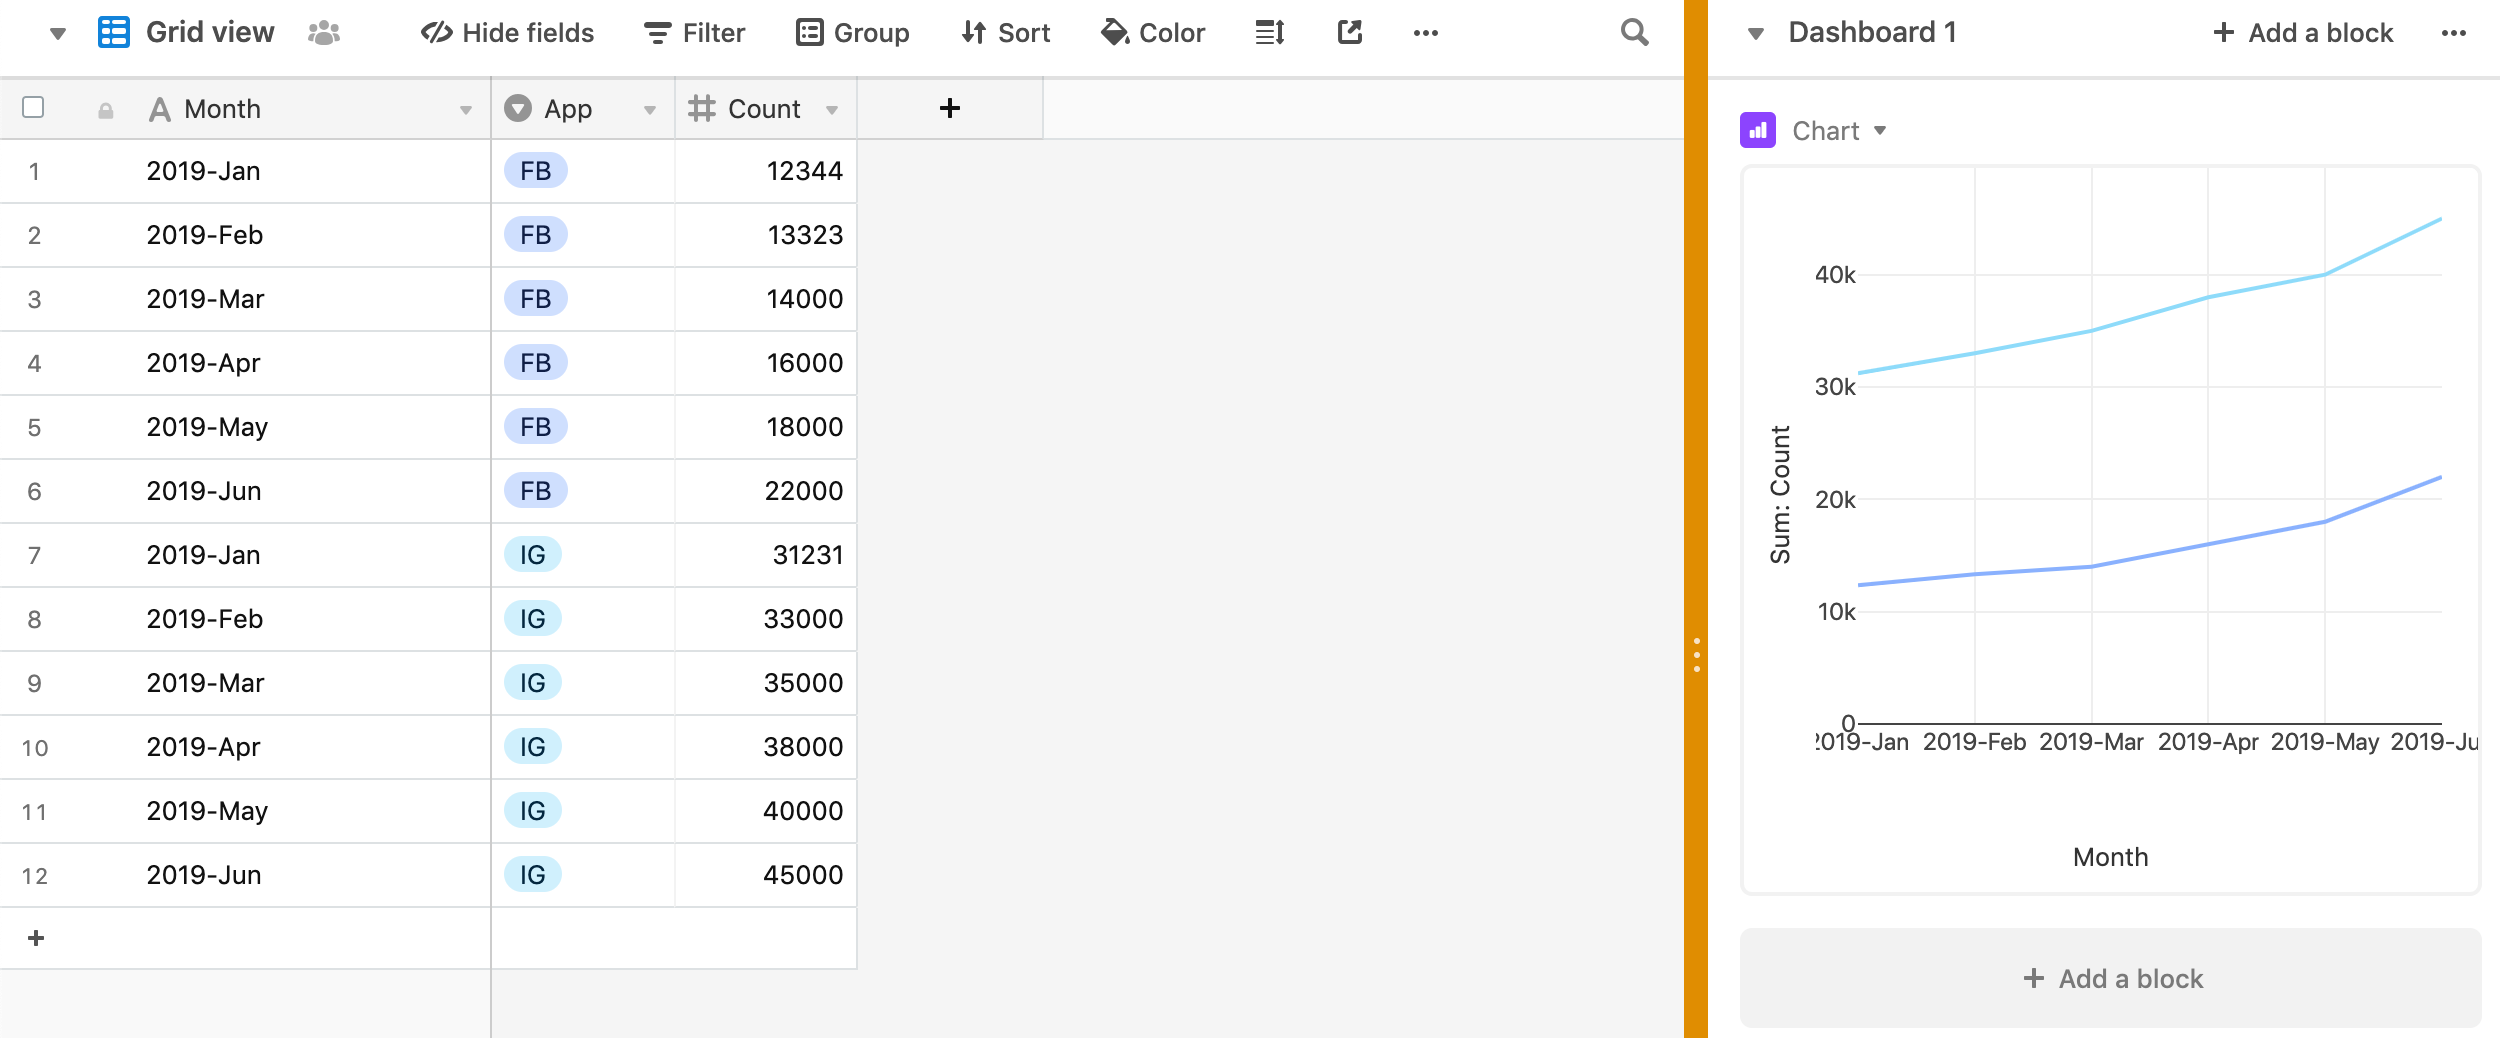
Chart Blocks somehow baffle me. I have a table with a month per year (so 2018 - 04 april) for instance as records and per record I have stuff like FB total likes, newsletter total size, IG total size. I would like to have 1 block that has all 3 together as lines, but I can’t seem to figure out how.
Am I doing it wrong or is it not possible with the table I made?
Chart Blocks - how to get lines together
This topic has been closed for replies.
Enter your E-mail address. We'll send you an e-mail with instructions to reset your password.


