Hi there -
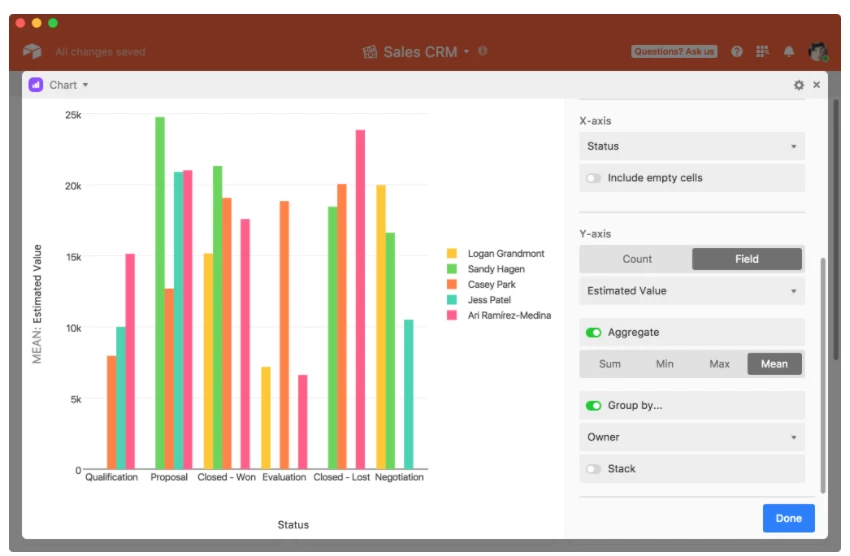
What’s the right way to display a chart that shows 3 months of progress per status? I wanted to show a chart that has June, July, August by status (# of complete vs incomplete), so ‘complete’ bar visual will show 3 bars (for June, July, Aug) and same for the ‘incomplete’ bar. APpears to be possible based on the sample chart on airtable, but I am stuck! Help.