I have a Base where I keep track of all of the feedback I’ve been getting on my product from User Tests. In this Base, I have multiple different tables for each of the tests I run. Each table has all of the data from my tests such as the question being asked, the different answer choices, the number of responses to that answer, and the percentage of people that chose that response. I want to create a chart for each of the questions I’m asking but it seems like the Chart app only creates charts based on ALL of the data in the table.
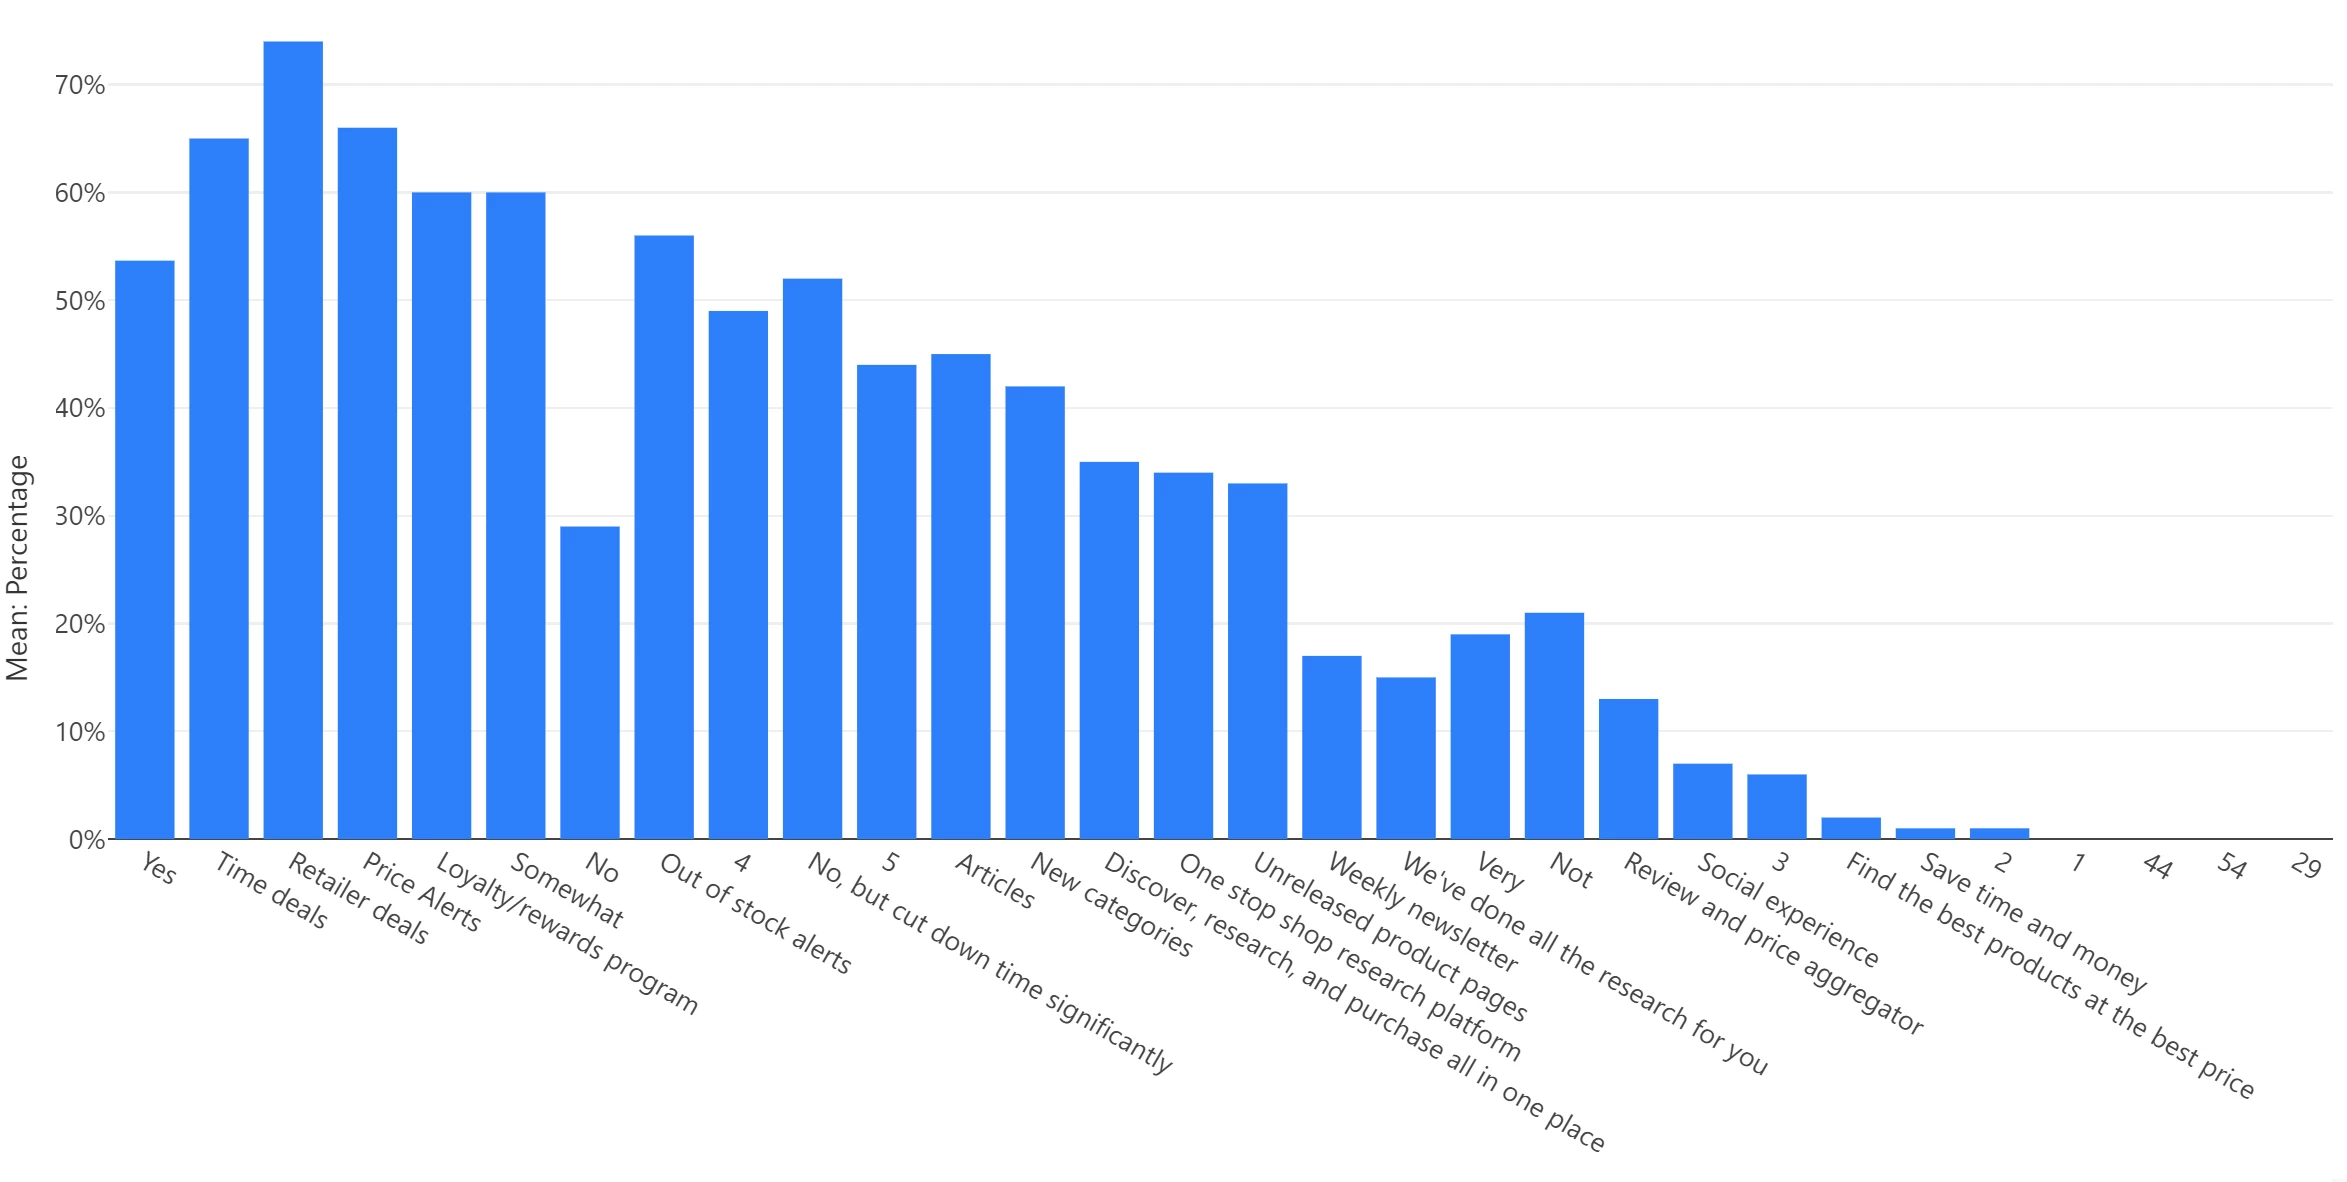
So the end result I am getting is this: A giant clump of all the different answer choices all grouped together.