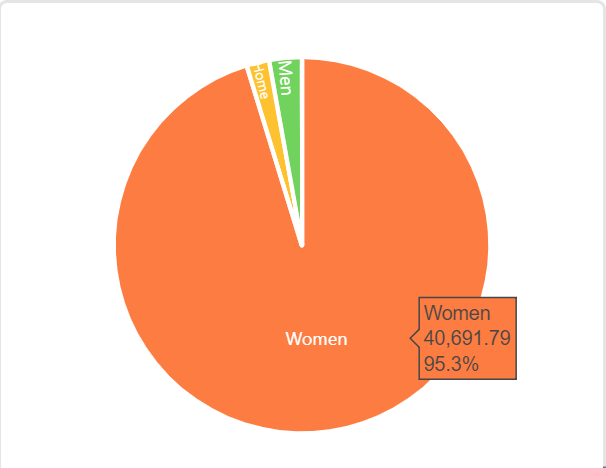
Hi, I’ve been trying to visualize data in blocks using charts and was wondering if there’s a way to add data labels to these charts. For example, if I make a pie chart, is there a way to mention percentages on the chart. At the moment I only see the percentage when I hover the mouse on the chart. (see image)