I have a base table in the following format, many groups each with tags and a count of the tags.
I can currently chart the count of tags, but it shows all groups. I’d like to only chart one group at a time. Is this possible?
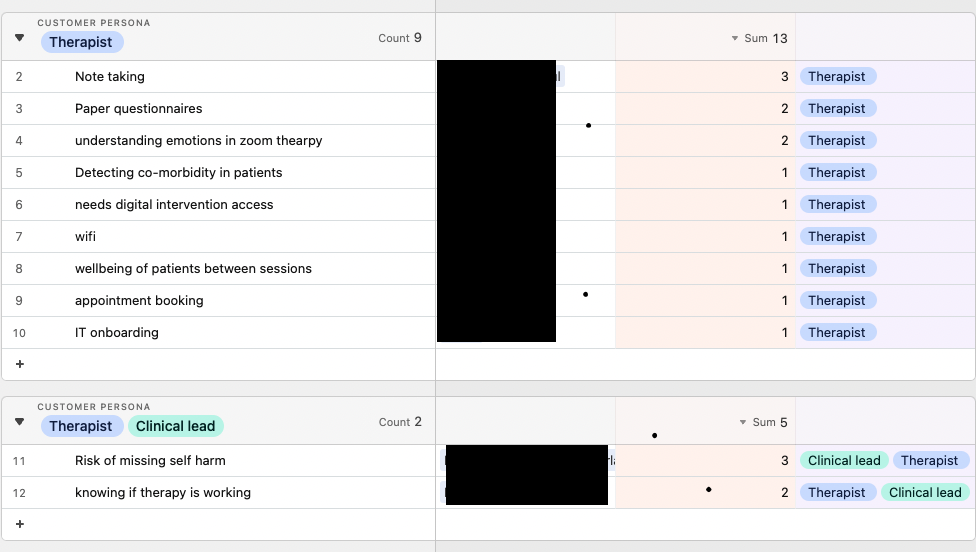

I have a base table in the following format, many groups each with tags and a count of the tags.
I can currently chart the count of tags, but it shows all groups. I’d like to only chart one group at a time. Is this possible?
Enter your E-mail address. We'll send you an e-mail with instructions to reset your password.