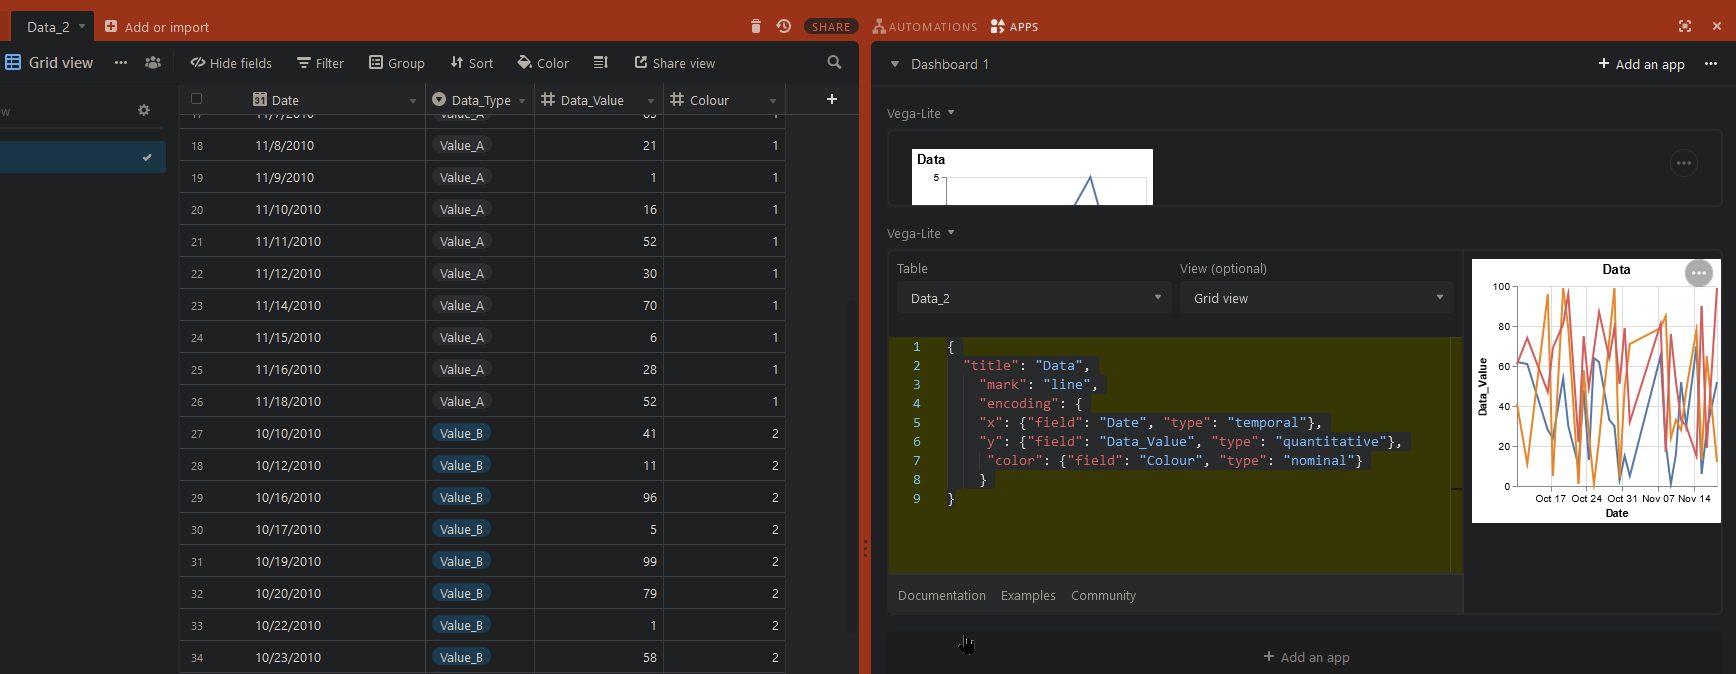
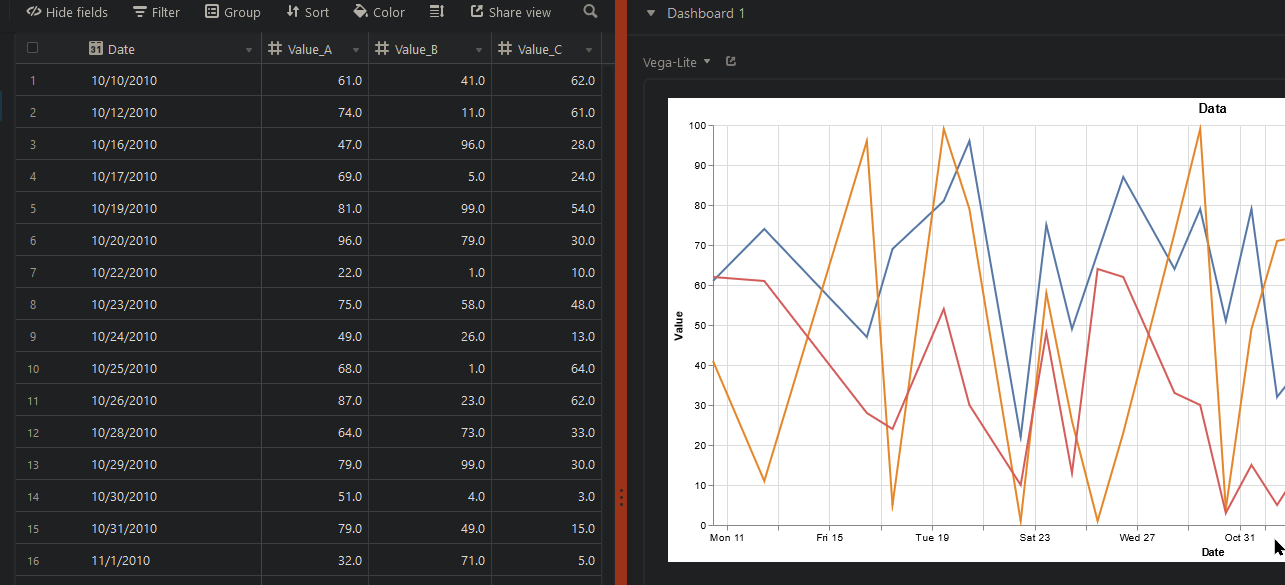
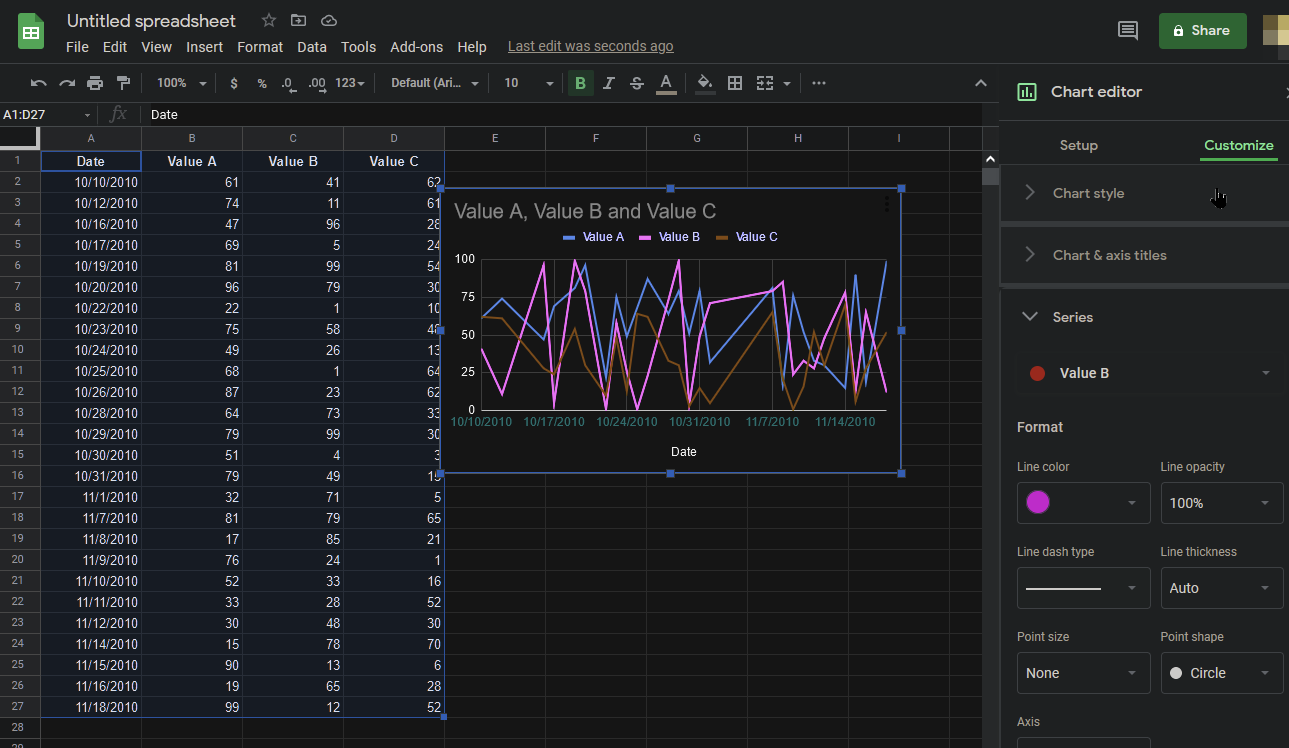
I’m struggling to get my head around how to draw a line chart in Vega-lite that displays multiple fields. I can get one field working, but am hoping someone can post an example of syntax required to do something like this (example from random values in Google Sheets);
Appreciate any help on this. Reading through the Vega-lite documentation is leaving me cross-eyed. :frowning:
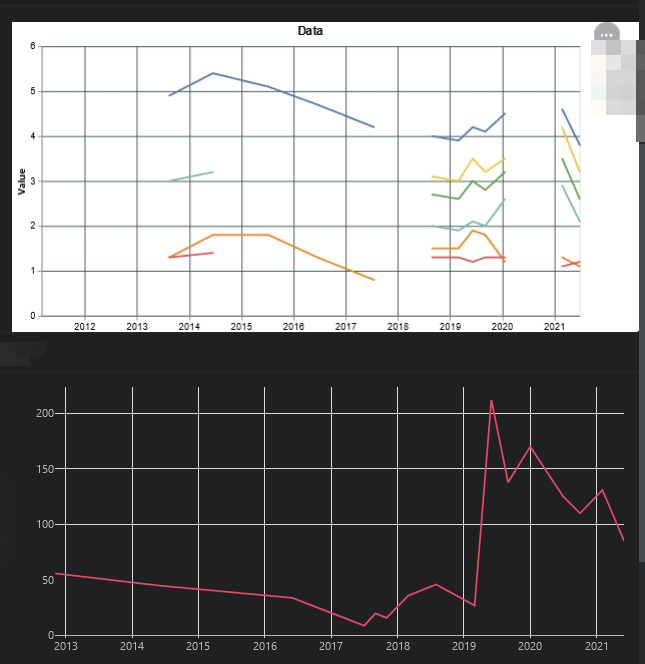
Extra points to show how a line can change colour as its value gets highter or lower. :grinning_face_with_big_eyes:
EDIT:
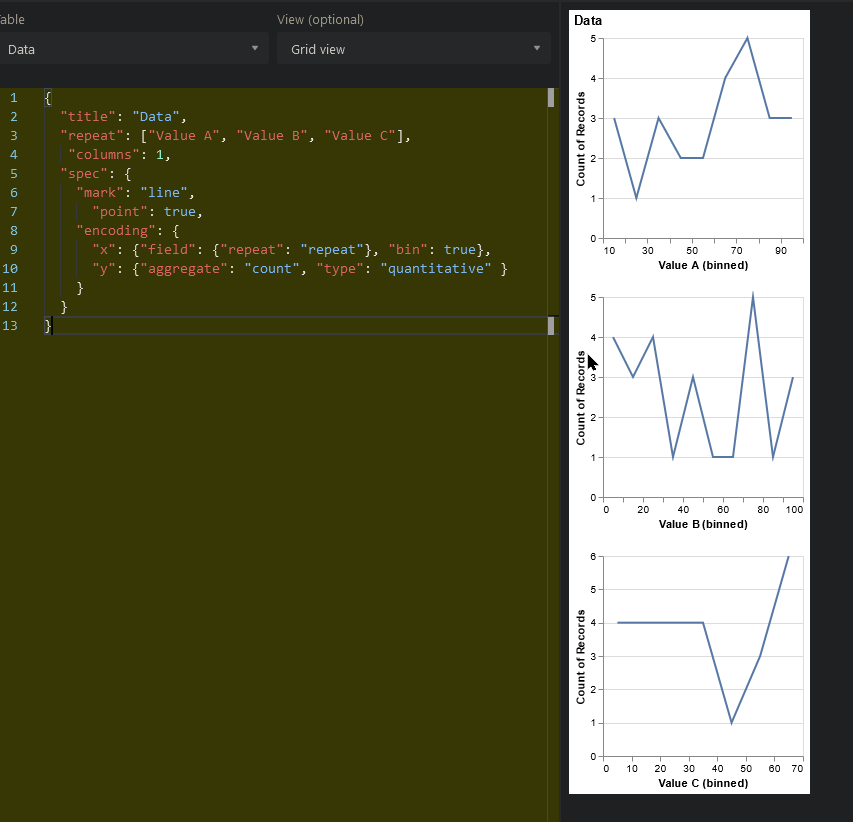
Ok, making progress… point data in 3 different graphs. Now to see if I can layer them.
{
  "title": "Data",
  "repeat": ["Value A", "Value B", "Value C"],
   "columns": 1,
  "spec": {
    "mark": "line",
      "point": true,
    "encoding": {
      "x": {"field": {"repeat": "repeat"}, "bin": true},
      "y": {"aggregate": "count", "type": "quantitative" }
    }
  }
}