Hello,
I have an airtable dataset that includes:
- Customers: all the information about customers
- Trainings: all the information regarding each training (including the date)
- Inscriptions: that combine Trainings and Customers and also add extra info (e.g. how much the customer payed for the training)
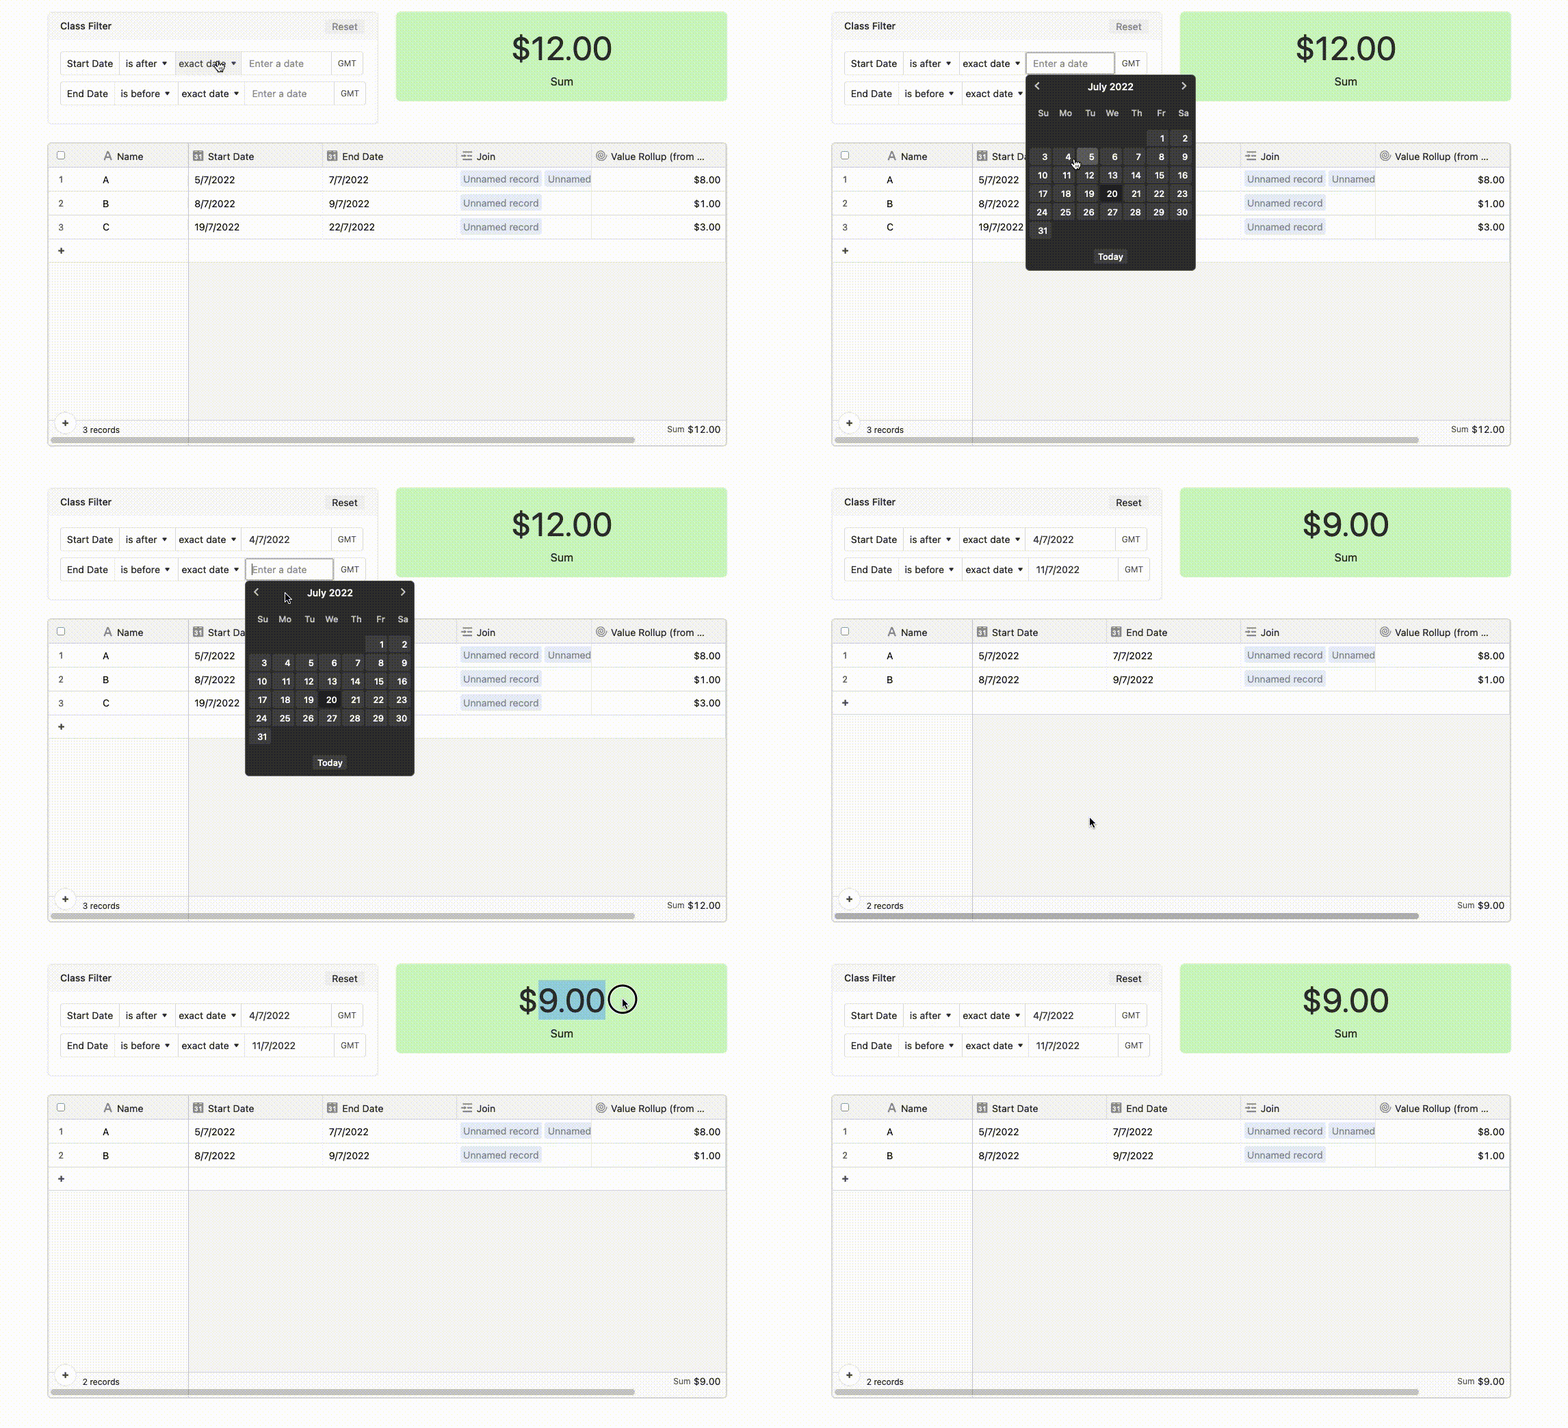
I want to build a Dashboard Interface where someone could state a “start date” and “end date” and the dashboard would show:
- All the trainings in those dates: this seems easy, just used a grid of trainings filtered by those date inputs)
- The total of revenue from those Trainings
In the last bullet, how can I get the SUM of the revenue from all inscriptions in the trainings that are filtered by those dates?
Thanks a lot


