

In Interface -
Is it possible to improve the amount of detail shown directly on a line chart? I’m looking for:
-a point at every data point (instead of just a line with no points)
-a label for a price at each data point (not just on hover over, but directly on the chart)
-more frequent numbers/hashes on the Y-axis (my y-axis price)
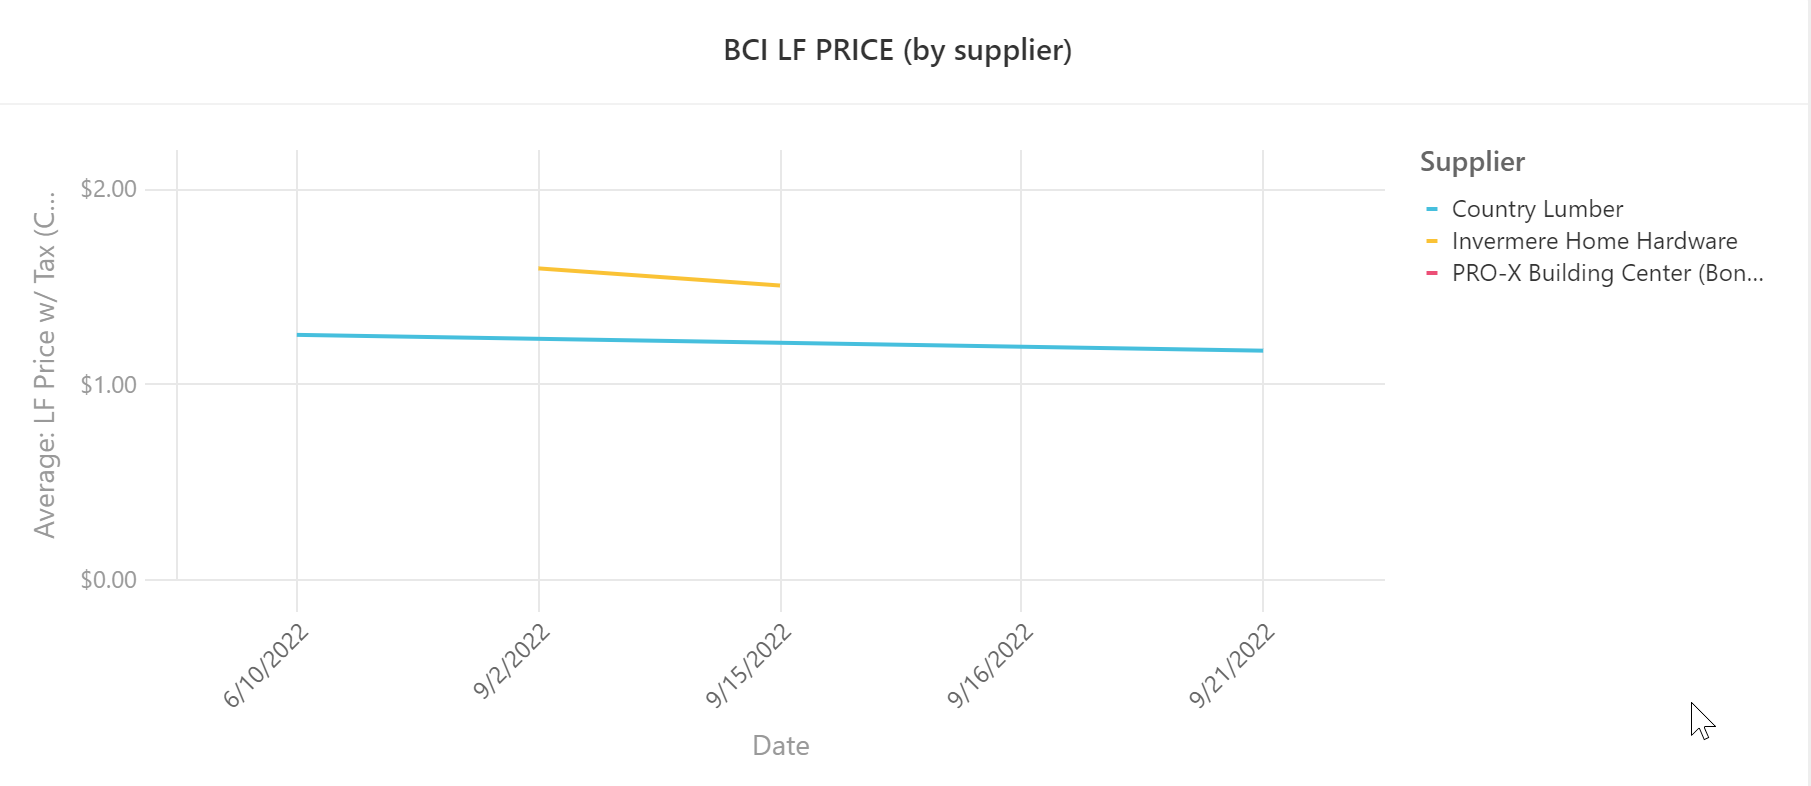
-also looking for the ability to not aggregate…
-also looking for the ability to have multiple groupings
-would also be wonderful to have similar functionality to the Charts extension where you can click on a point and open up the record from the Base…
…any tips appreciated!