
Hey there,


I would like to show:


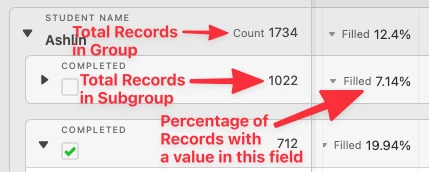
  1. Total Number of Vendors


Defined as the # of vendors in each cohort. This lives on a tab called “Vendor - Main View”


  1. Total Number of those Vendors with Completed “AERs”


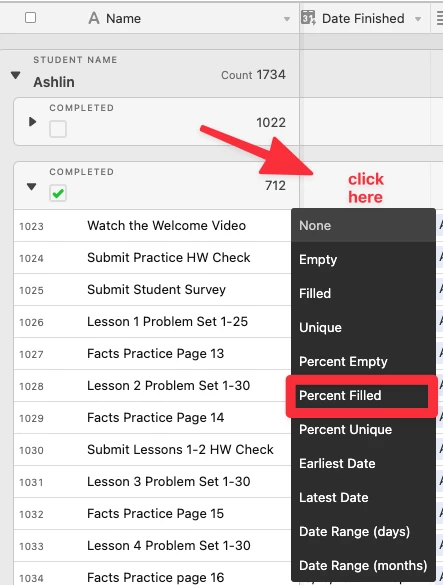
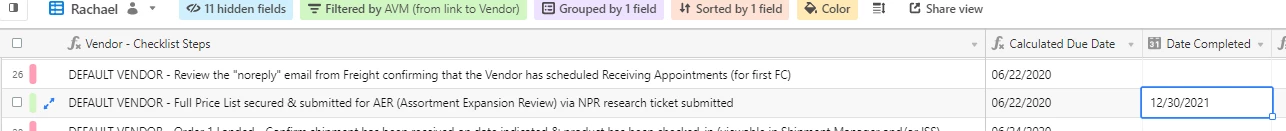
AER Completion is defined as a date corresponding to the Step 27 shown here in the table named “Checklist v2.0”. (An empty cell implies the step is incomplete)


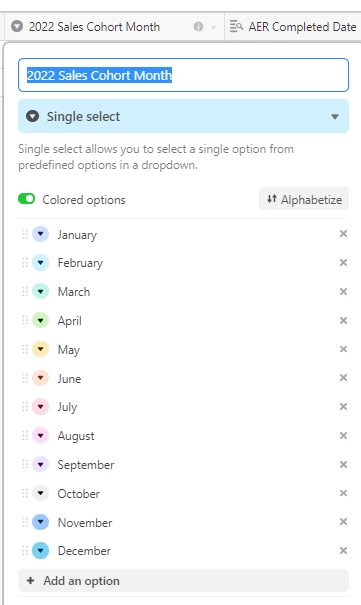
The thought is that we’d show “Of the 12 vendors in the January cohort, only 9 of them have completed AERs” “Of the February Cohort, 2 have completed AERs”.


Thanks in advance for your help!

Hi @Rachael_Castelaz


I think you could probably make this happen just by creating a view that:


  1. Groups records by “2022 Sales Cohort Month”

    • This will give you a total number of vendors in that cohort as a number of records in that group


  2. Uses the “% Filled” summary formula on the “Date Completed” field

    • This will produce the % of Completion you are looking for in the grouping bar for each Cohort Month group by showing the % of records in that Cohort Month Group that have a date filled in for the “Date Completed” field


Thanks, Jeremy. I should have mentioned that one of the end goals is that the % can be a field tied to the vendor, so that we can export the csv with that %. Knowing that, do you have a different suggestion?


Reply