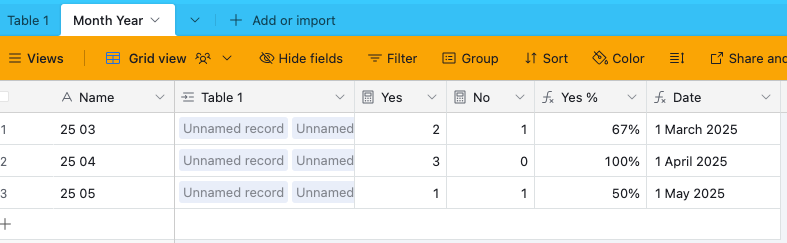
In my interface I can provide a Pie chart that will show the % of yes and no responses to a survey question.

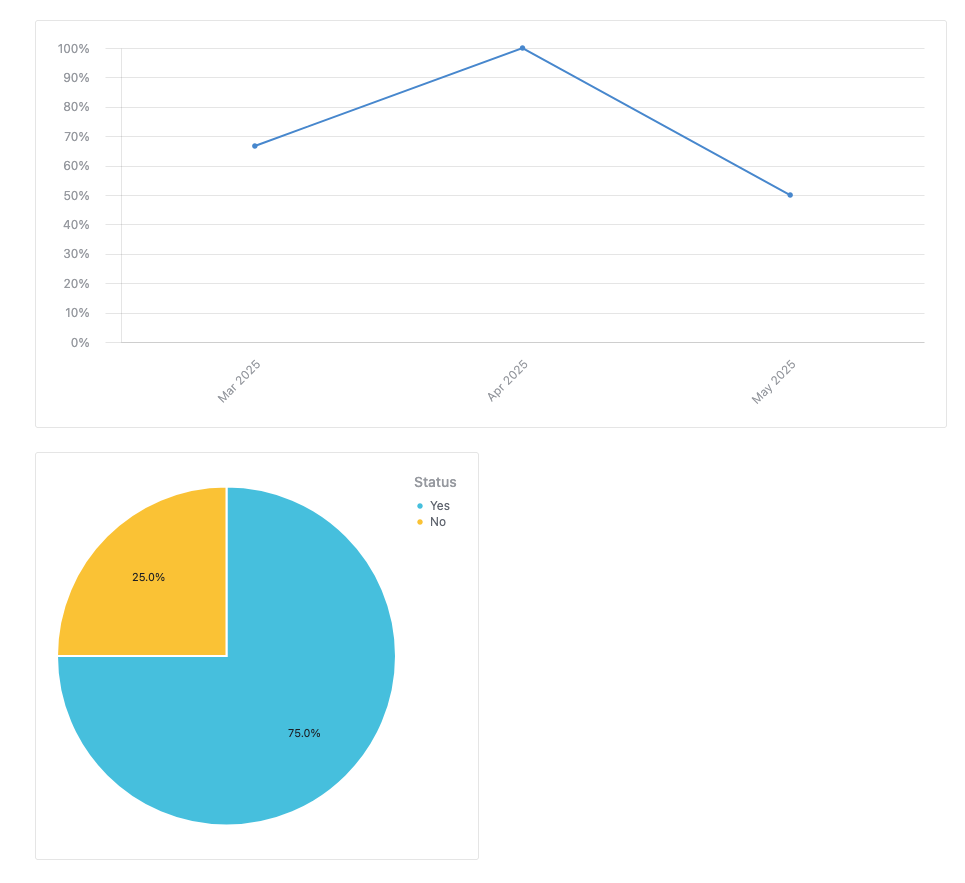
Each response, yes or no, is tied to a month value. I want to see the % over time of the people that reported yes to display a trend chart month over month. Example in Jan 42% reported Yes, in Feb 100% reported yes. This would be similar to my average satisfaction score month over month.

How do I take the Yes/No answers and convert them into a % of the population in order to track month over month?