

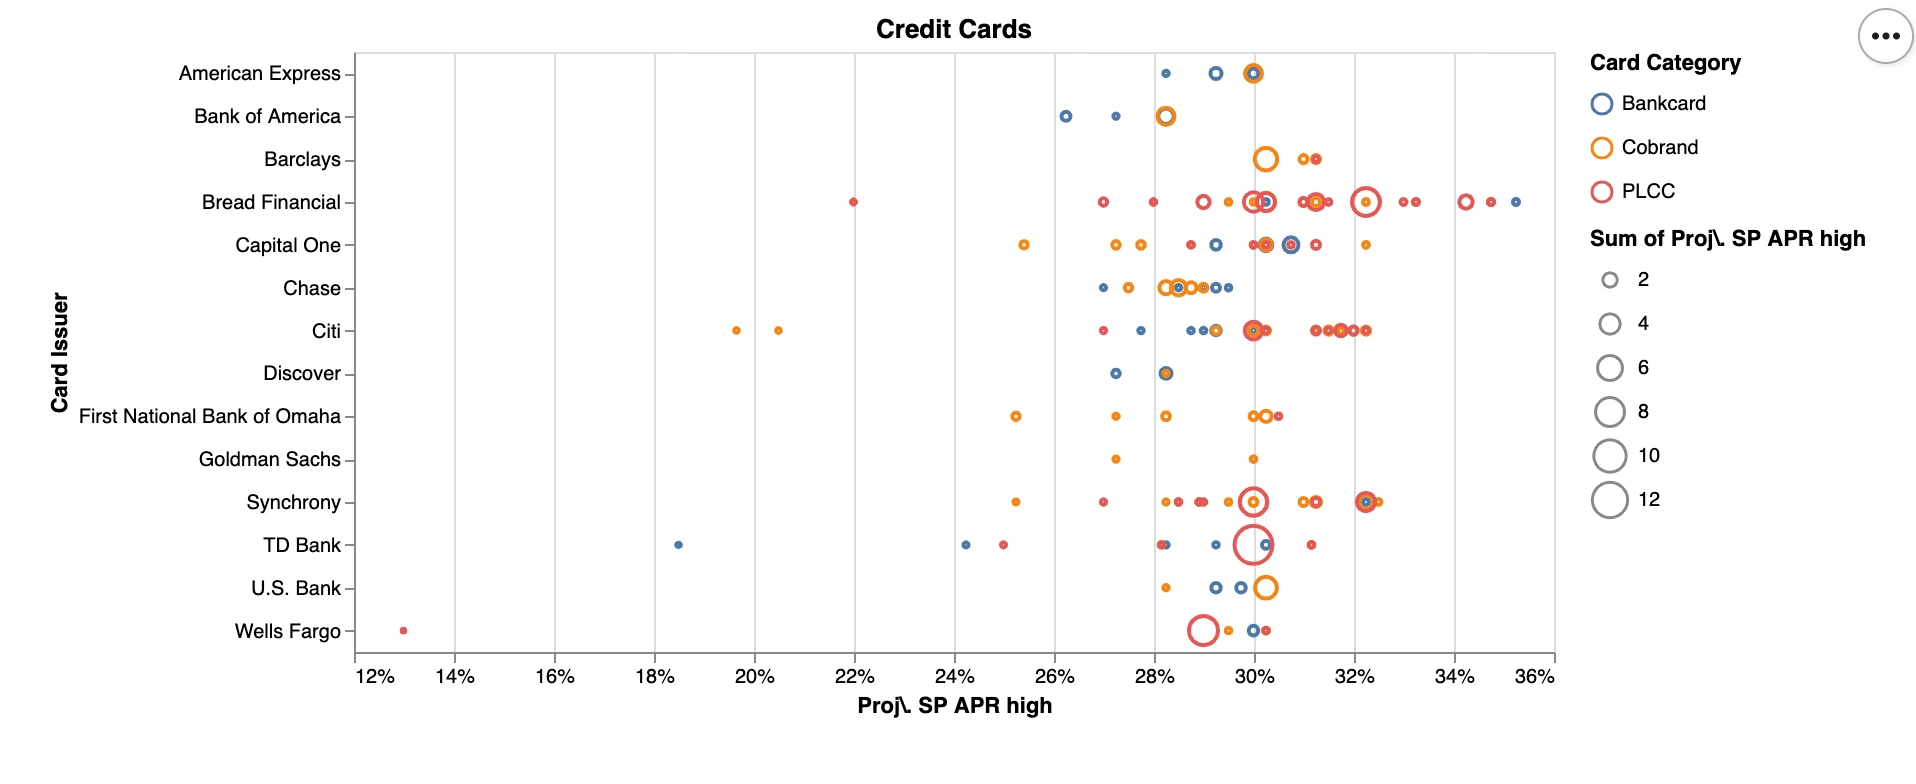
I cannot figure out how to get a Vega-Lite chart to sort the Issuers in the y axis by the max APR value. Any ideas??
{
  "$schema": "https://vega.github.io/schema/vega-lite/v4.json",
  "title": "Credit Cards",
  "width": 600,
  "height": 300,
  "mark": {
    "type": "point"
  },
  "encoding": {
     "x": {
      "field": "Proj\\. SP APR high",
      "type": "quantitative",
      "axis": {"grid": true, "format": ".2p"},
      "scale": {"domain": [0.12, 0.36]}
    },
    "y": {
      "field": "Card Issuer",
      "type": "nominal",
      "sort": {"op":"max", "field":"Proj\\. SP APR high"}
    },
    "size": {
      "field": "Proj\\. SP APR high",
      "type": "quantitative",
      "aggregate": "sum",
      "legend": {"clipHeight": 20}
    },
    "color": {
      "field": "Card Category",
      "type": "nominal",
      "legend": {"clipHeight": 20}
    }
  }
}