I have a table that looks like this…
CompanyName, CompanyID, AttributeA, AttributeB, Phase1Start, Phase1End, Phase2Start, Phase2End
In other words, 1 row per company, with lots of start/end date columns for multiple phases of a large project.
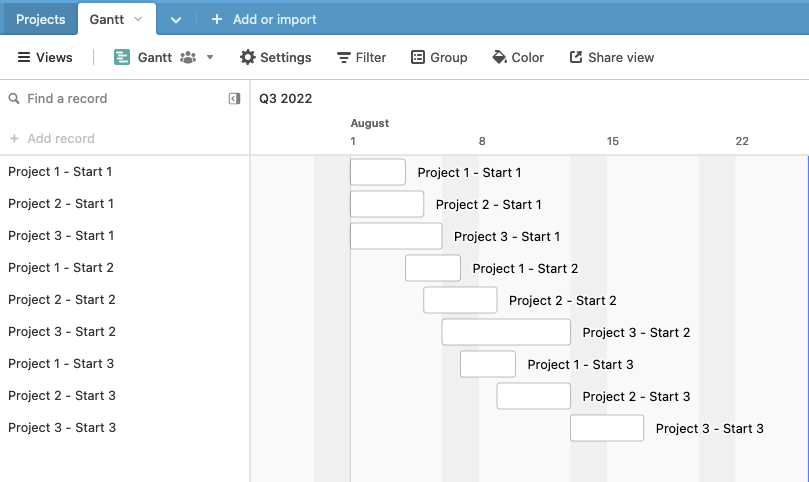
I now want to plot those phases with some kind of timeline view but am struggling to achieve this with Timeline or Gantt. Calendar view at least allows me to specify multiple input dates per row, but the view isn’t really appropriate for managing a project.
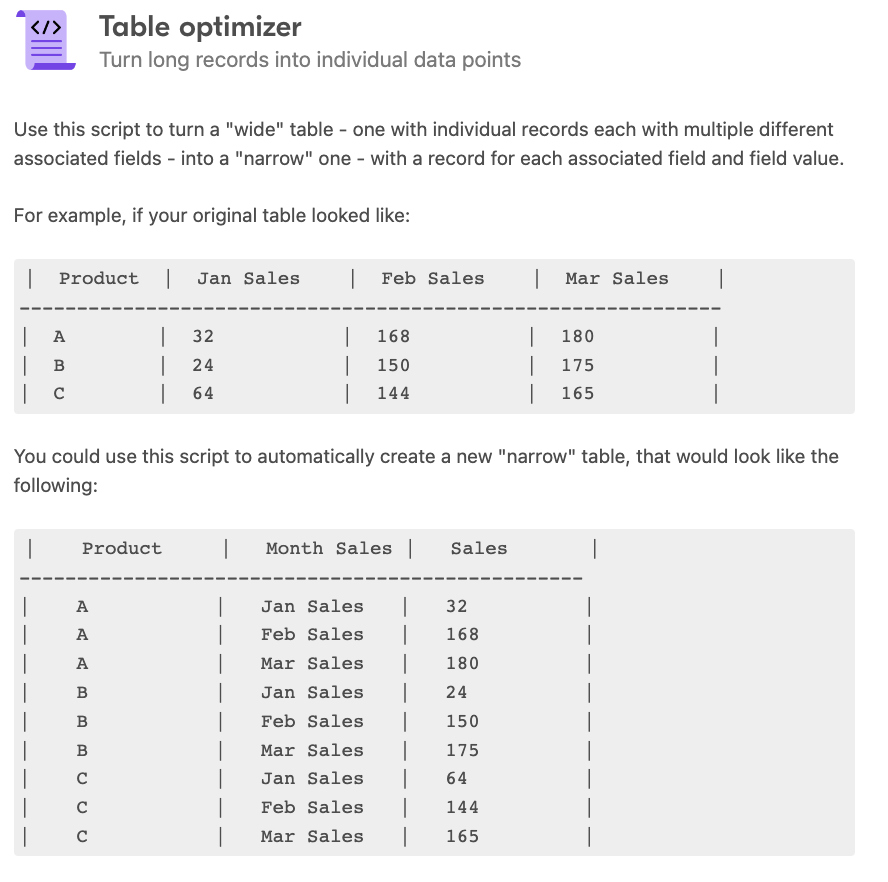
I can see one potential solution which is to create multiple rows in my data per company and then group the various rows by company in my timeline. But I really want to avoid doing this and dramatically messing up the structure of my initial base.
Has anyone else successfully plotted multiple phases of a project for a given row with a timeline view? Or even any other view that works well on project management? Thanks for any thought!


