Sep 18, 2023 04:35 PM
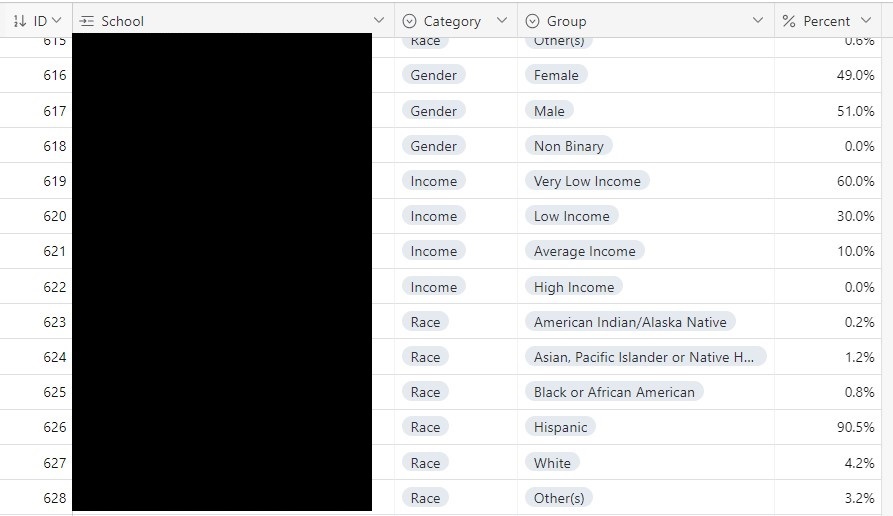
I have a list of schools and I'm trying to track demographics I have about the schools:
I have reports with the aggregate data, not the individual student records. Therefore I'm not able to do rollups but tracking each demographic for an individual students in a linked table.
What would be the best way to store the aggregate values, so that I can generate charts per school or across all schools? These categories have different amounts of choices too.
Solved! Go to Solution.
Sep 19, 2023 10:24 AM
I've decided to make a second table called Demographics, which links to the primary table Schools.
For each school, I have the same dozen demographics, broken down by category and grouping. I've used the record template tool to generate a blank demographic set for a school.
This allows me to create charts on a school level and total aggregate in interfaces.