Help

Save the date! Join us on October 16 for our Product Ops launch event. Register here.

Display a progress bar in Interfaces

Topic Labels: Interface Designer
611 2
cancel
Showing results for 
Search instead for 
Did you mean: 
JBJ
6 - Interface Innovator

Hi all,

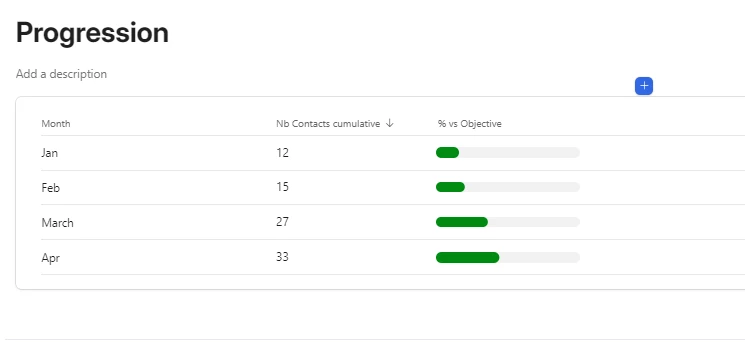
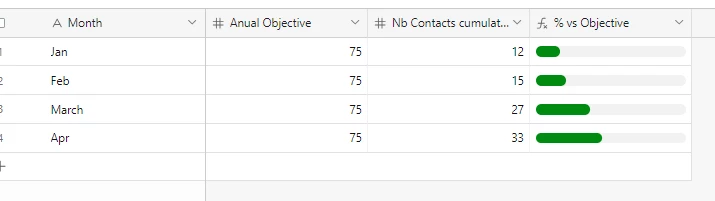
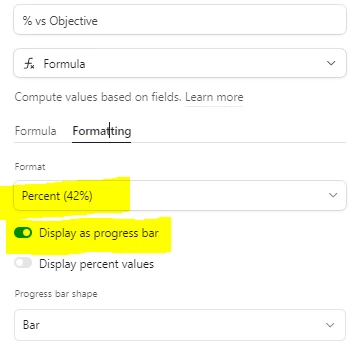
1. In my Interface dashboard, I'd like to be able to display the percentage of companies I got in touch with against the monthly goal of companies to contact. As of now, I visualized this as a bar chart, but I would like instead to visualize it as a progress bar.

2. In my pie chart below, I get percent values with one decimal digit. Instead, I would like to display integers, but I couldn't find a feature to edit the number formatting.

Do you guys know if what I'm looking for is possible?

Thanks.

PS: I saw that people had already asked a similar question, but since the threads were quite old I thought I might as well resurface the topic.

2 Replies 2

Hello,

You can display a progress bar in a list within an interface:

Pascal_Gallais_1-1720783289336.png

To do that, you need to define it in the table called by your list:

Pascal_Gallais_2-1720783368907.png

% vs Objective is a formula :

{Nb Contacts cumulative}/{Anual Objective}
 
With following formatting options:
 
Pascal_Gallais_3-1720783504597.png

This field can then be added as such in a list within an interface.

Regards,

Pascal


Hi @Pascal_Gallais-,

Thanks for your help. Not the best option to me compared to what dashboards look like on Metabase.