Hello and welcome to the Community @TCGpro_Shop!
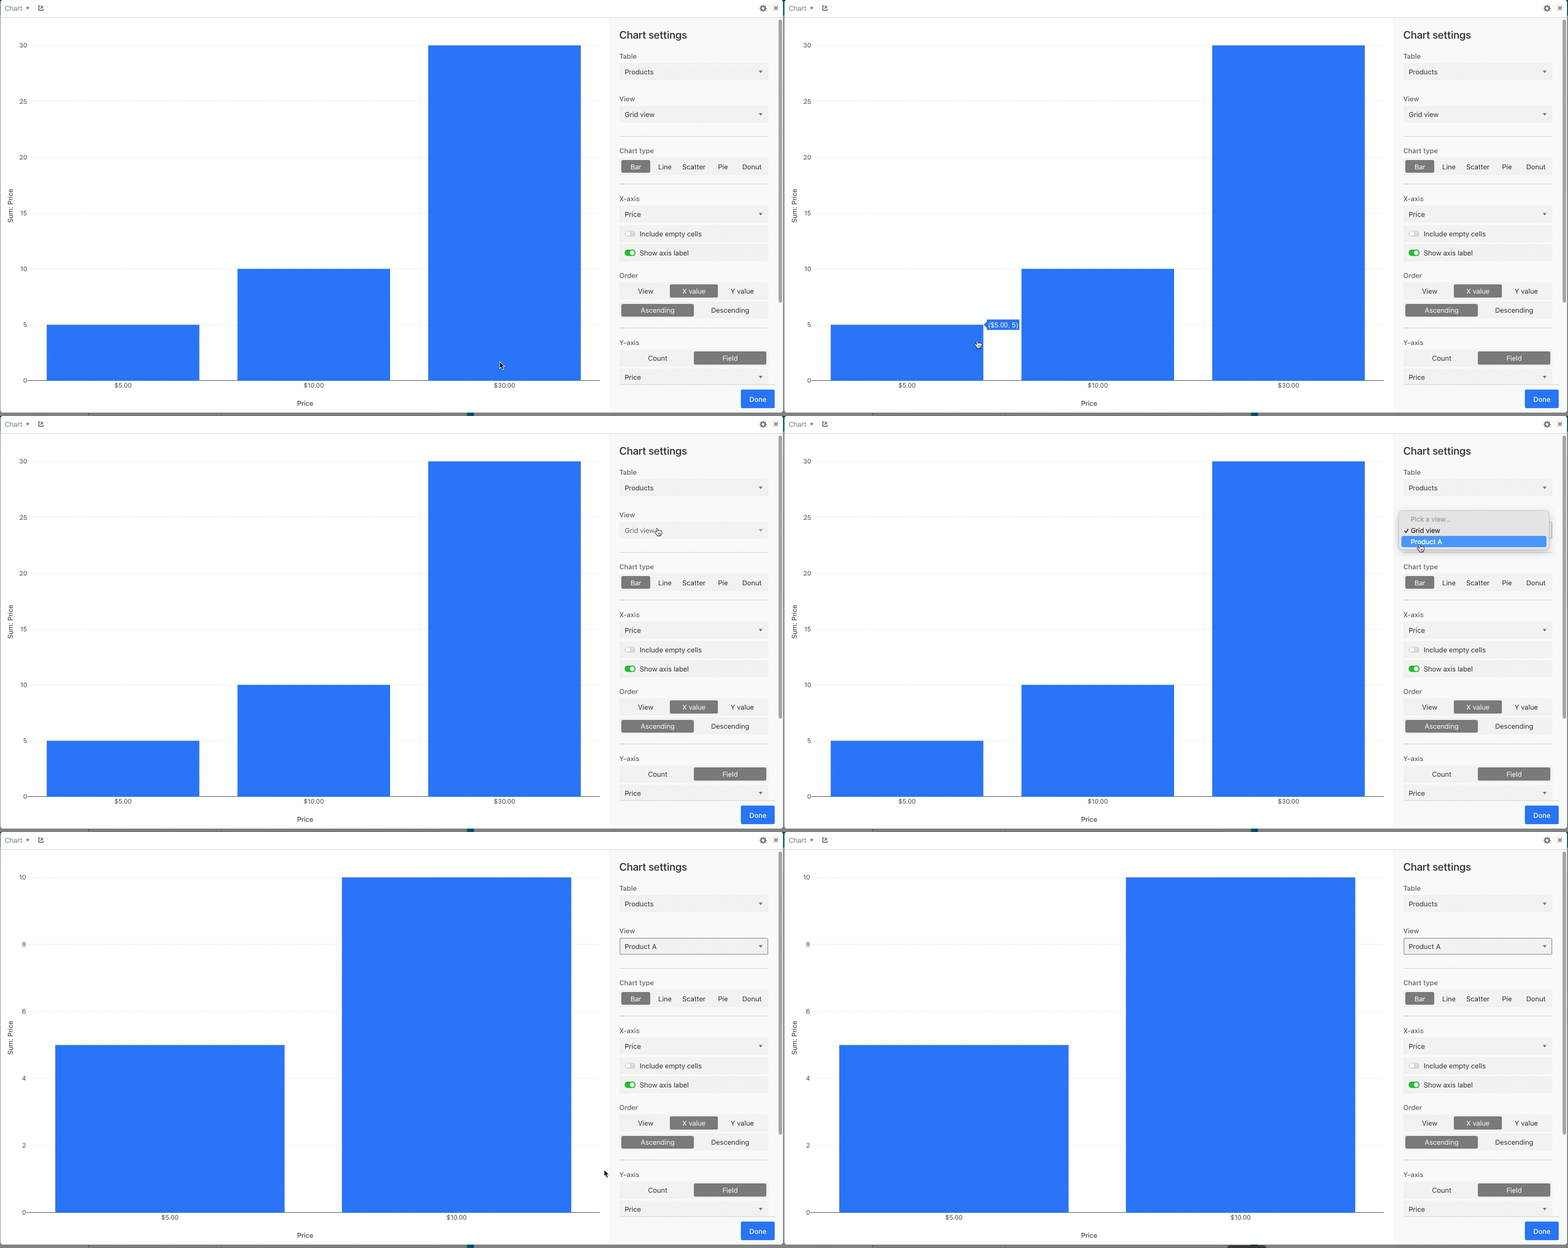
When using the Chart App we recommend creating views that capture the different slices of data you’d like to show in the chart (so in your case you could create separate views to filter down and focus on certain products).
So if this is my main table with all my products:

I could then create a new view only looking at Product A:

Then in the Chart App I can switch between the two views to see all the information in the table, and see the information just from the view I created:

Let me know if I can help provide any more information, and if this helped answer your question please mark it as the solution  .
.
Hello and welcome to the Community @TCGpro_Shop!
When using the Chart App we recommend creating views that capture the different slices of data you’d like to show in the chart (so in your case you could create separate views to filter down and focus on certain products).
So if this is my main table with all my products:

I could then create a new view only looking at Product A:

Then in the Chart App I can switch between the two views to see all the information in the table, and see the information just from the view I created:

Let me know if I can help provide any more information, and if this helped answer your question please mark it as the solution  .
.
I see, so currently the best approach is to make a view for each product manually. I’m not so sure about this as there’s a lot of products and I doubt I could click and type for each product for it 


 .
.