
Hello,
I’m trying to summarize information in a Linked Record field type collected through Forms in which respondents can select multiple linked records. We invite respondents to select their Subject Area Expertise, options provided are categories from a sector-wide set of standard taxonomy.
The Subject Area taxonomy is organized in a hierarchical manner. For example:
- Level 1 (Category): Health (SE000000)
- Level 2: Nursing Care (SE060000)
- Level 3: Home Health Care (SE60100)
- Level 3: Hospice Care (SE60200)
Respondents can select from the whole list without seeing the hierarchy. I would like to generate charts that summarize and collapse respondents’ answers. Using the example above, I would like the chart to collapse all individuals who selected “Home Health Care” and “Hospice Care” to fall under the bar/pie chart slice for "Health"
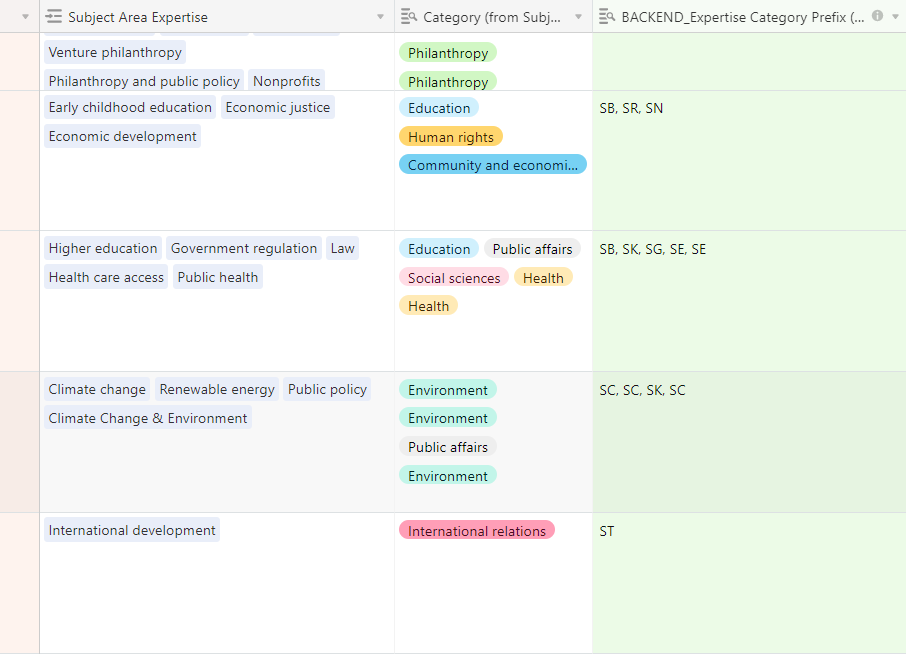
I tried using a lookup field for each Subject Area’s category, but it duplicates responses
In the example below, the row with three different “Environment” subject area will contribute to three counts of “Environment” in a chart I generate on Interfaces or the Chart block in Apps. I want it to reflect as one because all three belong to one individual/row.
I created binary dummy columns, but I can’t summarize these
My workaround was to use the Number summary of formula field results. Each Level 1 category has its own formula field, where the formula is:
IF( FIND(“SE”, {BACKEND_Expertise Category Prefix (from Subject Area Expertise)}), ‘1’, ‘0’)
(the prefix is a lookup from the table where Subject Areas are saved).
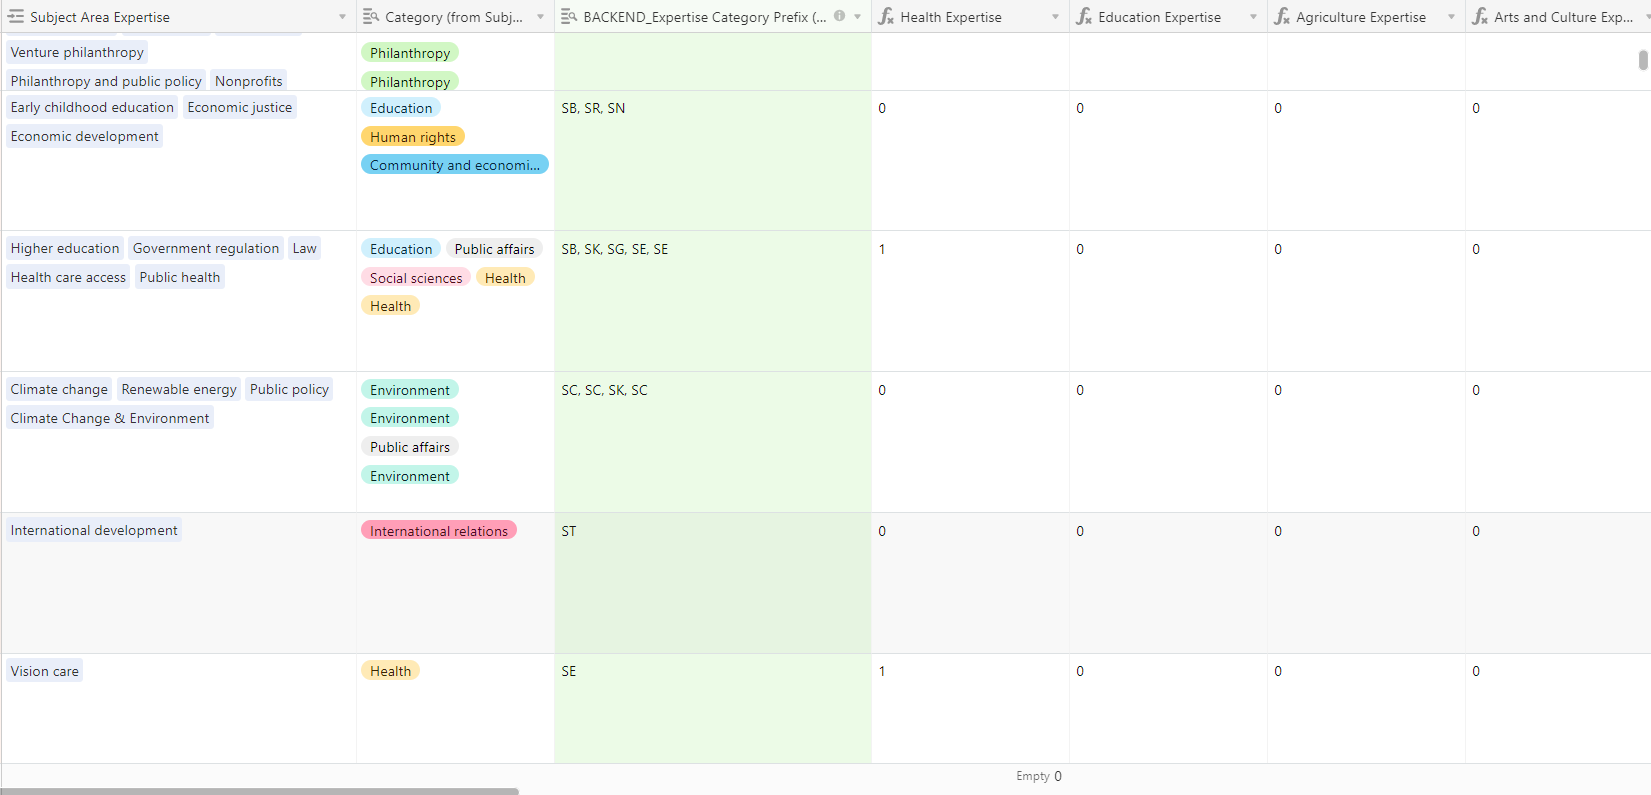
But the formula field isn’t considered numeric, so I can’t create summaries. Two questiuons:
- Is there a way to make this numeric?
- Any other suggestions on how I can summarize my respondents by their Level 1 subject areas selected in the forms for charts and graphs?
Thank you!!
