
Hi, non-dev here
I have been an avid user of Airtable and I'm enjoying it but there's some things like proper pivot tables and reports I wish were available.
So anyway, I am currently trying to build a report that uses live data from one table to another.
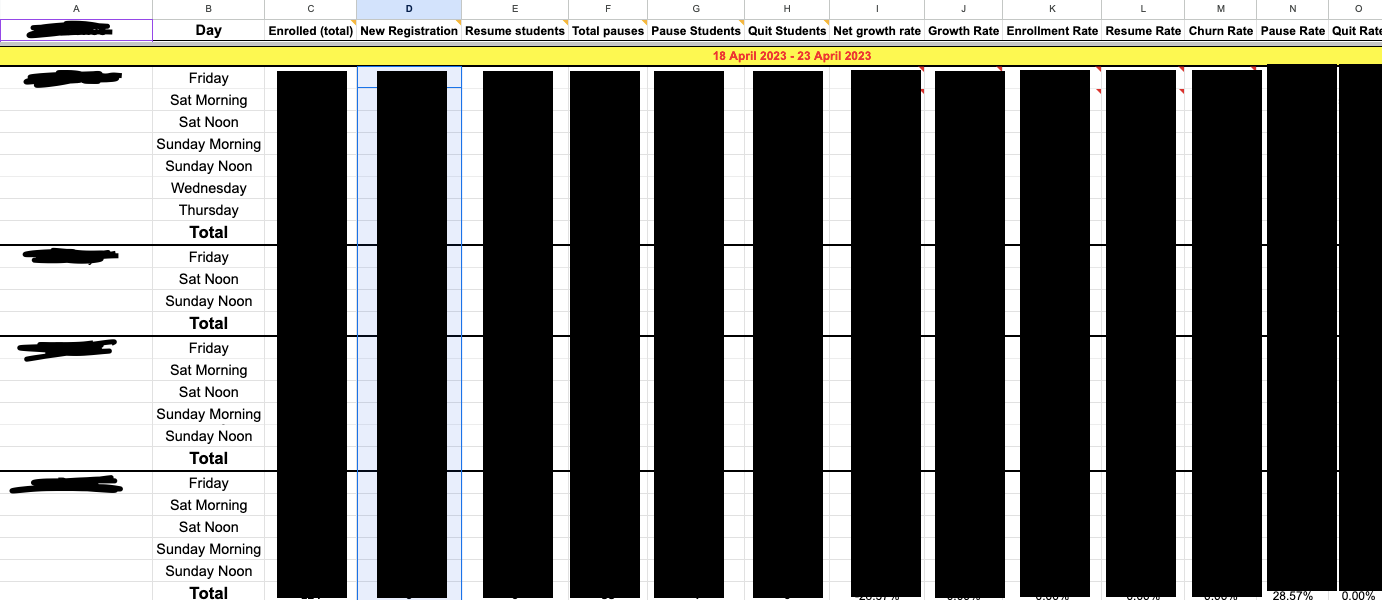
When we're using excel, this was how it looked, as you can see, we would manually input a lot of the fields, and check them manually, use formulae to help us calculate some of the metrics we wanted.
But we want live data and data that can be captured weekly on Airtable I've come up with a relatively.. tedious solution do let me know if there's a better way.
Here's what I did
- I created a new table to host the live data, link all enrolled students into this record, created a column for each cell in that table that is not calculated/formulae (about 200 columns)
- set up an automation to make sure every new enrolled student is linked to this table. Now I have live data that is extremely hard to view, I can build an interface and be done with this.
- Now the snapshots and the calculated fields.. I duplicate the table, and change every field from a count (with filters) to a number. Now I create another set of the same fields (i need to compare last week's data with this weeks data. And I create another set of formulae fields to do my calculations.
- I create an automation that basically triggers every week, find the live data, and find last week's data. Create a new record in the weekly snapshot table, and fill in every field (about 500 - 600 fields)
- Now I create an interface for this snapshot table for my report
Before I jump into beginning this tedious chore, is there a better way to do this?
Appreciate any form of help