Question

Timeline view in an interface with dates running on the Y axis

  • March 20, 2026
  • 4 replies
  • 25 views

Forum|alt.badge.img+2

Hi!

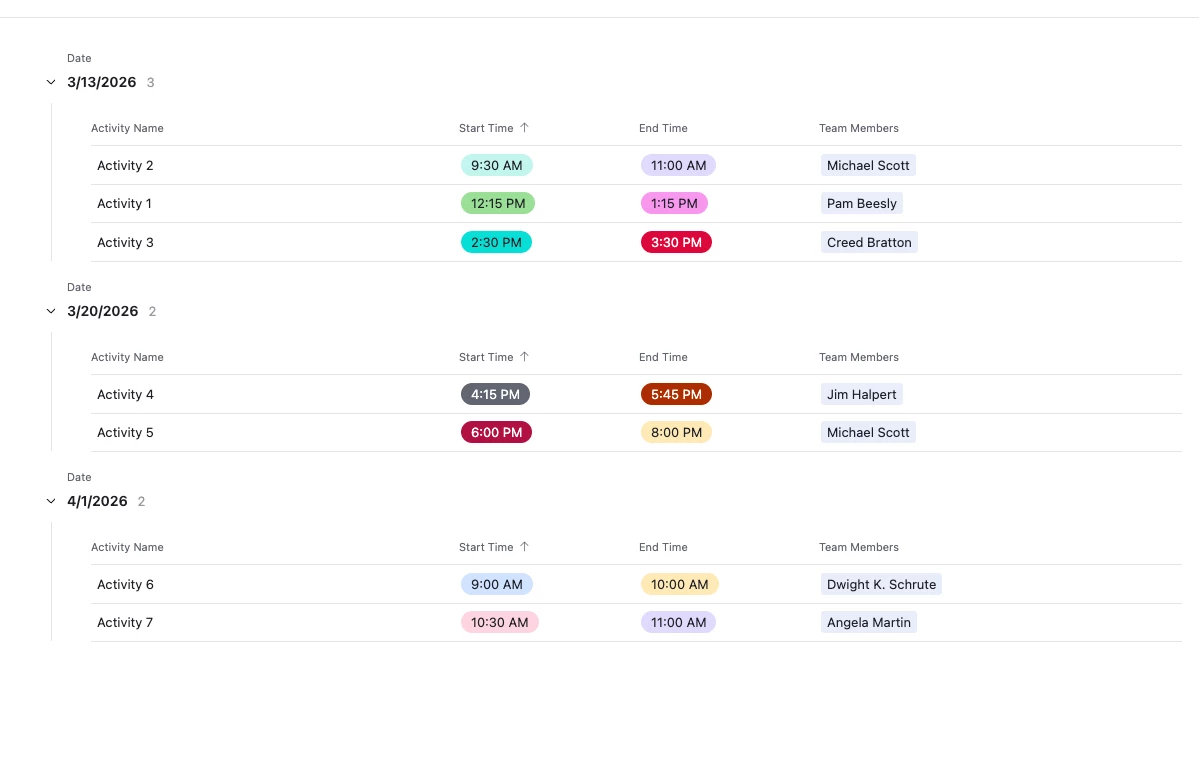
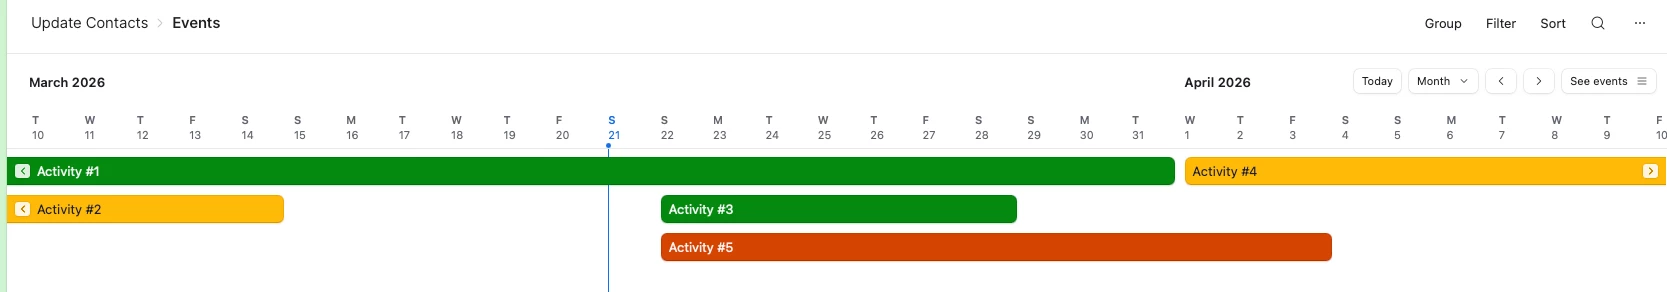
I am building an activity planner for an organisation and trying to achieve an interface page that shows a timeline view, but with dates running along the vertical (Y) axis rather than the standard horizontal layout. 

The idea is that users can scroll up and down to see multiple records (activities) lined up side by side against a shared time axis.

Has anyone managed to:

  • Replicate this with a different interface element or creative field/layout setup?
  • Use an embedded chart or third-party tool to achieve this?
  • Build something similar using a custom page or external embed?

Any workarounds, extensions, or even "close enough" solutions would be really appreciated. Thanks!

4 replies

TheTimeSavingCo
Forum|alt.badge.img+31

Hm, could you provide some screenshots of your data and timeline layout?  In my head using a Grid / List layout and sorting by the Date value would seem to work for this but I’m missing something I think!


Stephen_Biegner
Forum|alt.badge.img+2

Yeah. I haven’t ever seen a version of the Timeline view that flips the axes like your describing, but my mind went exactly where ​@TheTimeSavingCo went. While you wouldn’t be able to see activities going horizontally across a timeline, you could use a List interface that is grouped by date and then sorted by start times. I’ve attached a very rough mock-up of how this could work (truly - it’s the roughest), but I think it shows how users could scroll up and down to see multiple activities grouped together in the order they’re set to take place. You could obviously include additional information, descriptions, locations, etc., but this maybe gets at what you’re aiming for. Though I also feel like I could be missing something. 

Here’s the screenshot of a 5-second mock-up:

Let me know if that’s on the right track. I imagine you could add an additional level to the list view, and collapse all the groups. The date line could have a high level overview of the number of activities for a given day, and users could expand any date group to see unique events to drill down further. 


Forum|alt.badge.img+2
  • Author
  • New Participant
  • March 21, 2026

Thanks ​@TheTimeSavingCo and ​@Stephen_Biegner, I was also considering a Grid or List view that might fit my requirements, but the biggest challenge is that the organisation wants to see how their planned activities unfold and overlap over time. It's less about start/end times and more about start/end dates, they want to see where gaps exist, so all dates should appear in the calendar regardless of whether there is activity on those dates or not.


Basically this, but running vertically instead of horizontally! To be honest, I might just need to persuade them to start working across instead of down.


TheTimeSavingCo
Forum|alt.badge.img+31

Ah hmm, yeah for that you’d need to have a new table where each day is a single record with the links set up appropriately

The overlapping thing would only be visible by the number of linked records to the ‘Events’ table though, does that make sense?  Could add a Count field with conditional coloring?  Won’t be as clear as the timeline view for sure I’m afraid

Pretty doable with an automation and a Run Script action!  Let me know if you want to go down that road and I’ll see if I can throw an example together for you