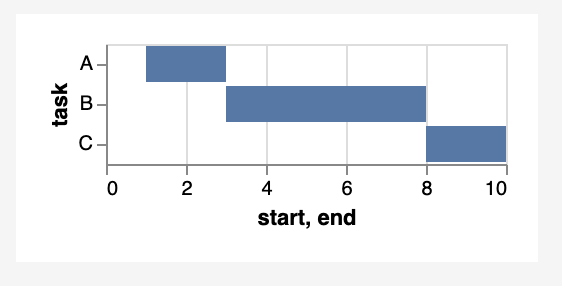
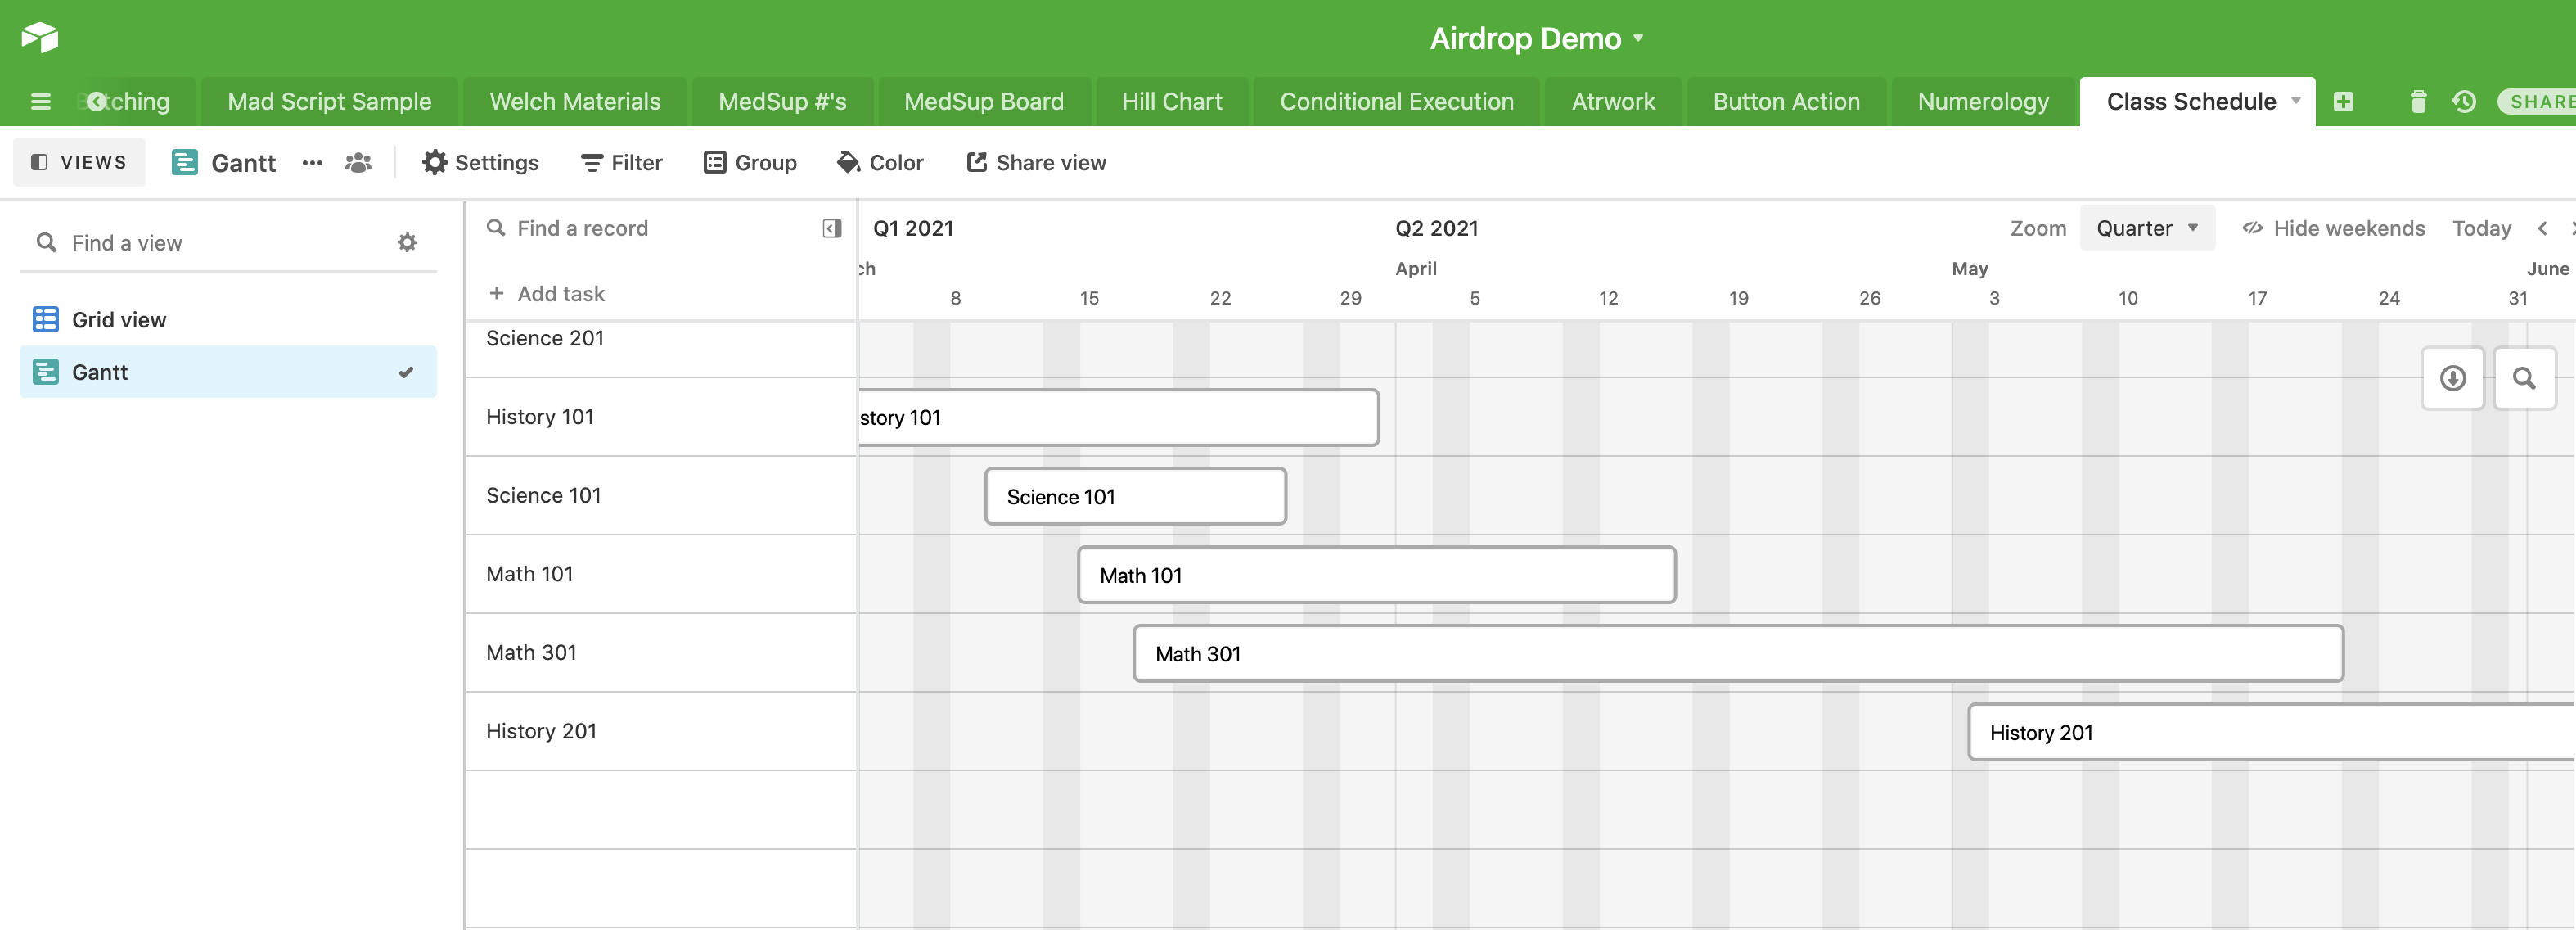
Does anyone know if a Gantt Chart can be configured to show record names by people assigned? My base tracks class names and dates (the primary defining fields for the table) along with people who are assigned to each of those class instances. The people are assigned in a separate column. I’m able to configure a Gantt to show class names, based on the start and end dates. I can even add the assigned people’s names to the label. However, I’d like to show names of people on the left side of the chart, with date range along the top side of the chart, then color blocks would be instances that each person is teaching. I just can’t figure out how to get the left side to organize by person instead of by class.
Thank you for any advice!
Customize Gantt
This topic has been closed for replies.
Enter your E-mail address. We'll send you an e-mail with instructions to reset your password.


