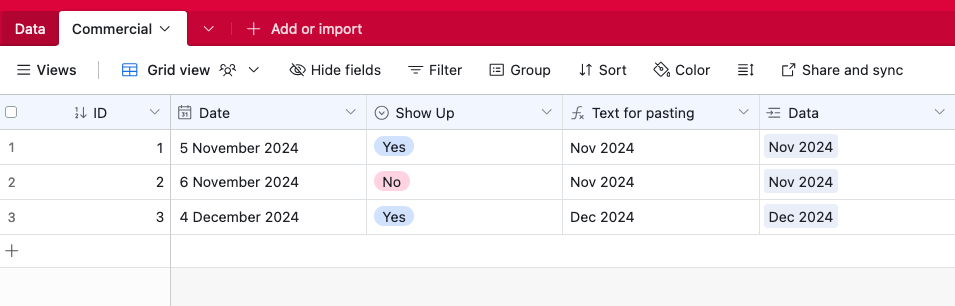
I'm working with Airtable and I want to populate information into the Data table and create a simple automation to it monthly.
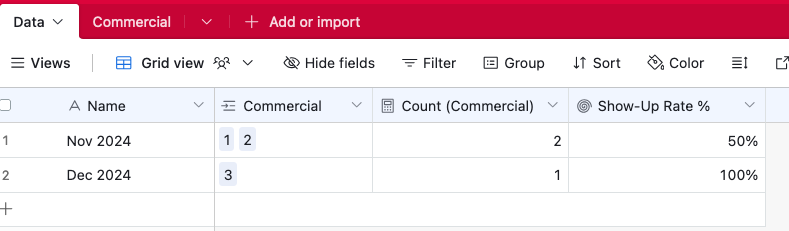
This Data table is supposed to show a monthly overview of multiple data points from the Dpto. Comercial table (Commercial table). I want to have a formula inside the Data table showing these columns: Show-Up Rate %, Cancelled Calls %, Close Rate Based on Show-Up %, Close Rate based on Booked Call %, and Disqualification % (Information which can be obtained from the Commercial table.
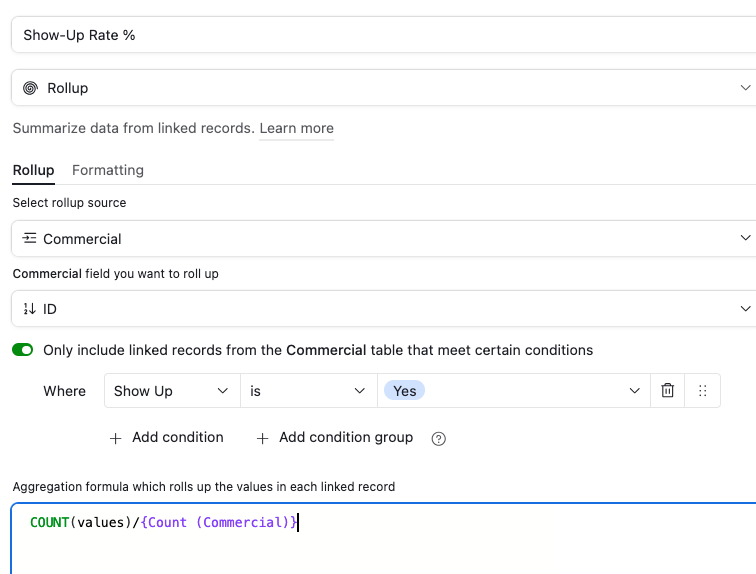
I need help for a way to create multiple columns inside the Data table with formulas that tackle each of the points described above dynamically, for every month.
No need to start from scratch - there are columns already.
No need for interfaces - we just care about the correctness of the data.
Points to Consider:
For example, the Show-Up Rate % should probably be created this way: When and IF lead has "Asistencia" (Show Up) column marked as "Si" (Yes) it means it's a show-up and it should be divided by "Llamada Agendada" (Booked Call) -> Maybe this should be improved to remove inconsistencies, but this is the general idea for every column other column mentioned above.