Hi -
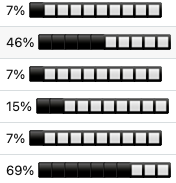
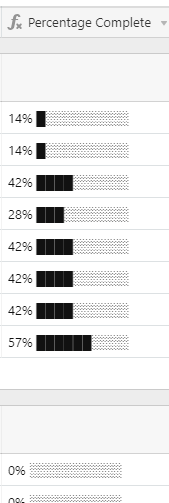
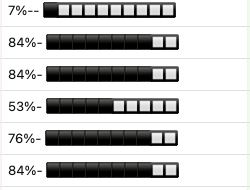
We’re looking to pull a percentage of a task complete and reflected that % as a progress bar in a cell for a single record. We want the progress bar to be continuous (up to an integer) as the % of the task completed is updated… I.e. (just one of many use cases) if we have a record that is counting # of forms submitted for a given record, and the total number is noted in the record, the percentage of completed forms with respect to the completed record is reflected in an updating graphic progress bar.
Bootstrap plugin example: https://www.w3schools.com/bootstrap/bootstrap_progressbars.asp.
The progress bar Airtable feature should update from as the percentage cell on the record self-updates upon completion of a given trigger elsewhere in the Airtable ecosystem.
Many thanks!

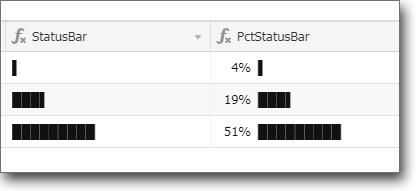


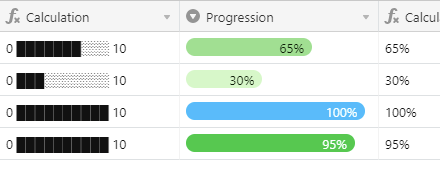
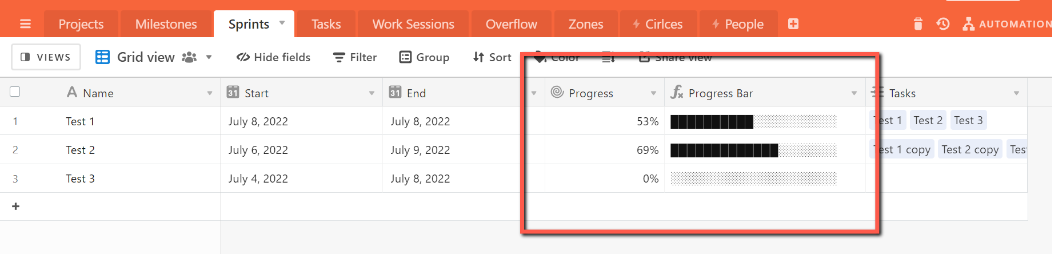
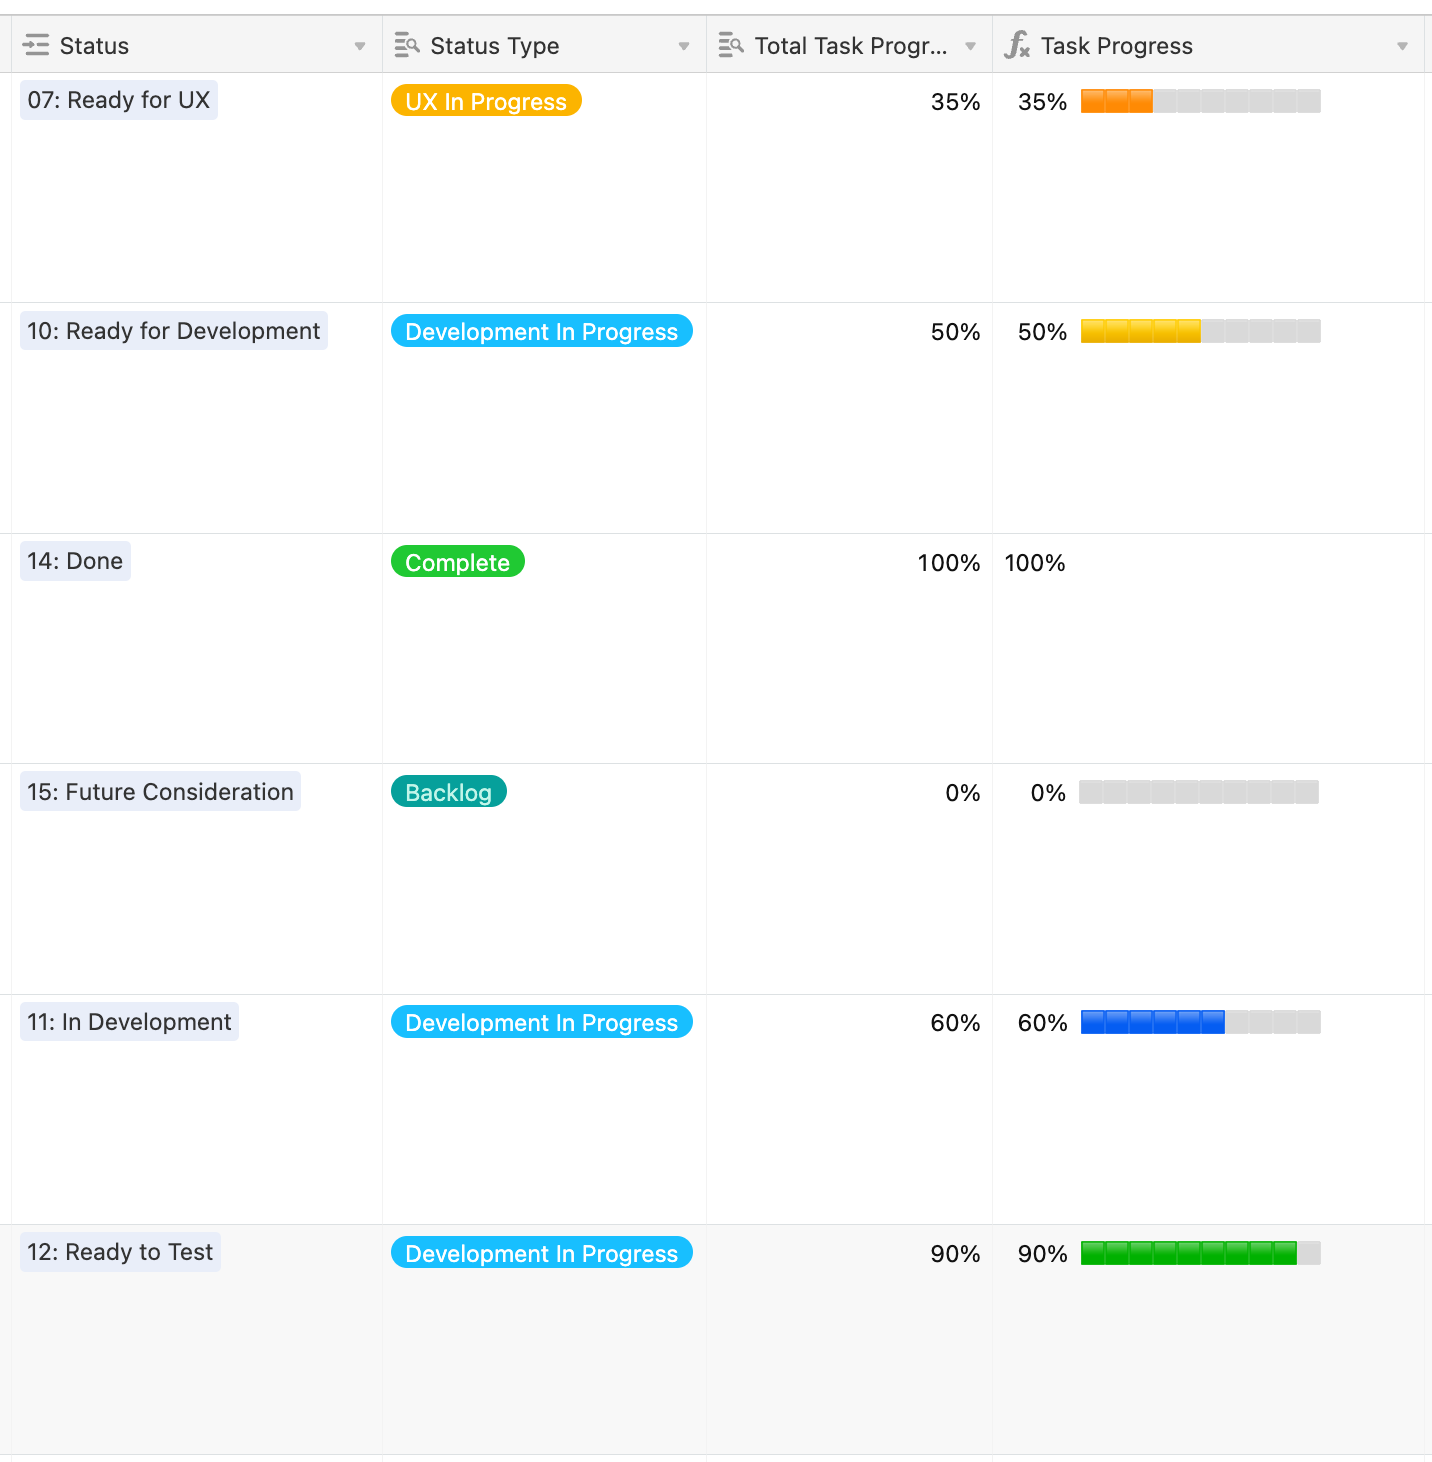
 vs
vs