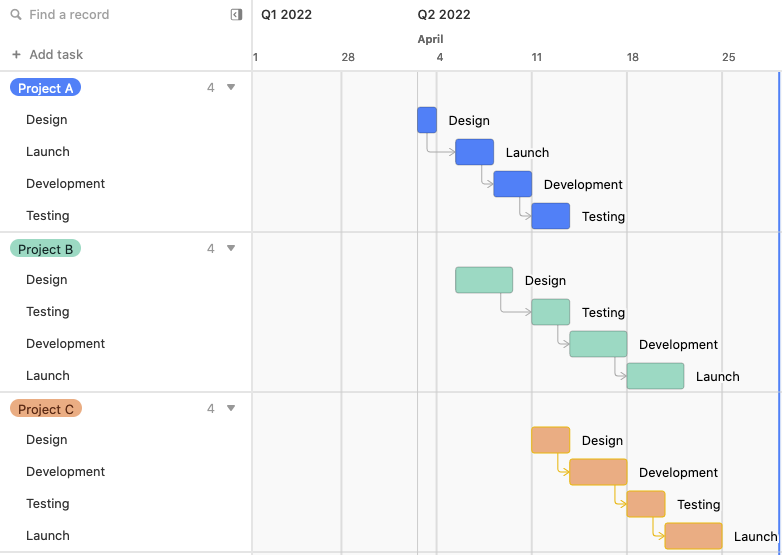
Hi! I have been looking to build a gannt chart that has the ability to measure different timelines for different projects, and I want to be be able to see the whole process. I have seen a couple of floating gannts but it doesnt really fit my need. I am looking to build something similar to the photo below.
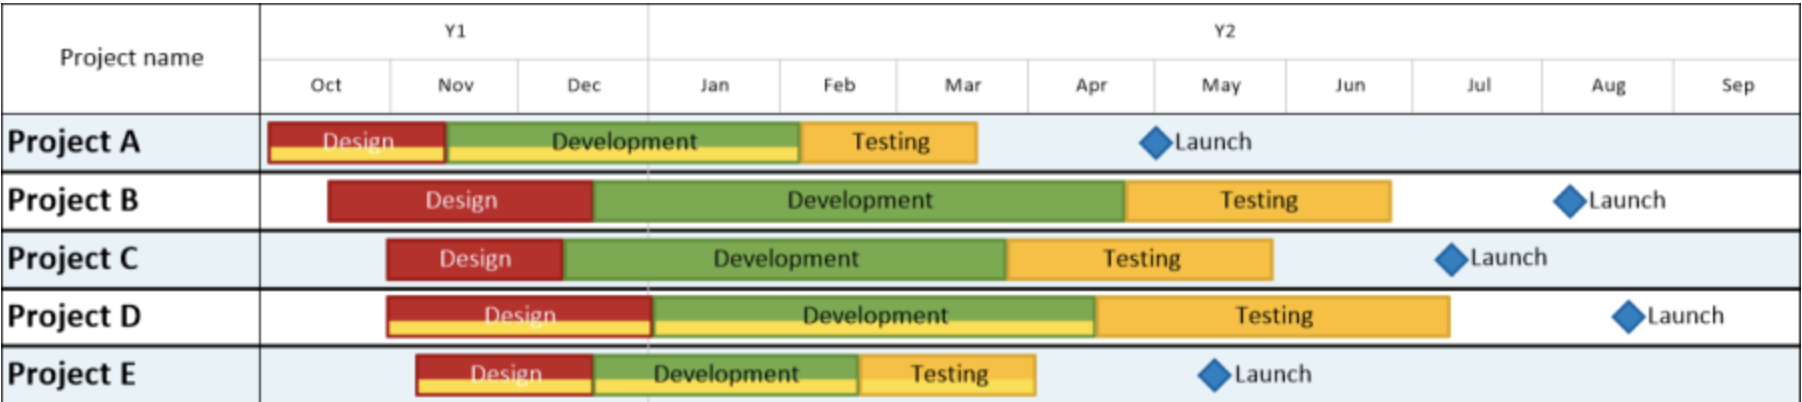
Does anybody have any idea how to create something like that by any chance?
Hey @Solomon_Chang, hmm, so you’re trying to put all of a project’s related tasks into one row, instead of multiple rows as seen below?
Yea in a way. I think the problem that I have is that all the data is centeralized in on line inside of the grid view that I want to blow out to show progress. Do you know if that is possible.
To rephrase better, I have data like:
Project 1; start date: sprint 1 start date; sprint 1 end date; sprint 2 start date; sprint 2 end date… etc
Project 2; start date: sprint 1 start date; sprint 1 end date; sprint 2 start date; sprint 2 end date… etc
And I would like to get a view like the one above.
Ha! I actually just solved this issue yesterday in this thread!
Have a look and let me know if I can help further
Reply
Enter your E-mail address. We'll send you an e-mail with instructions to reset your password.