Heya,
We have an interface where we display charts from a base. However, I am wondering if there's a possibility to adjust the data incoming from the base before it gets displayed.
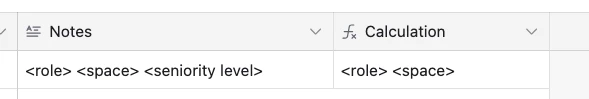
For example, there's a field that we need to reformat in a specific way before it gets picked up by the charts.