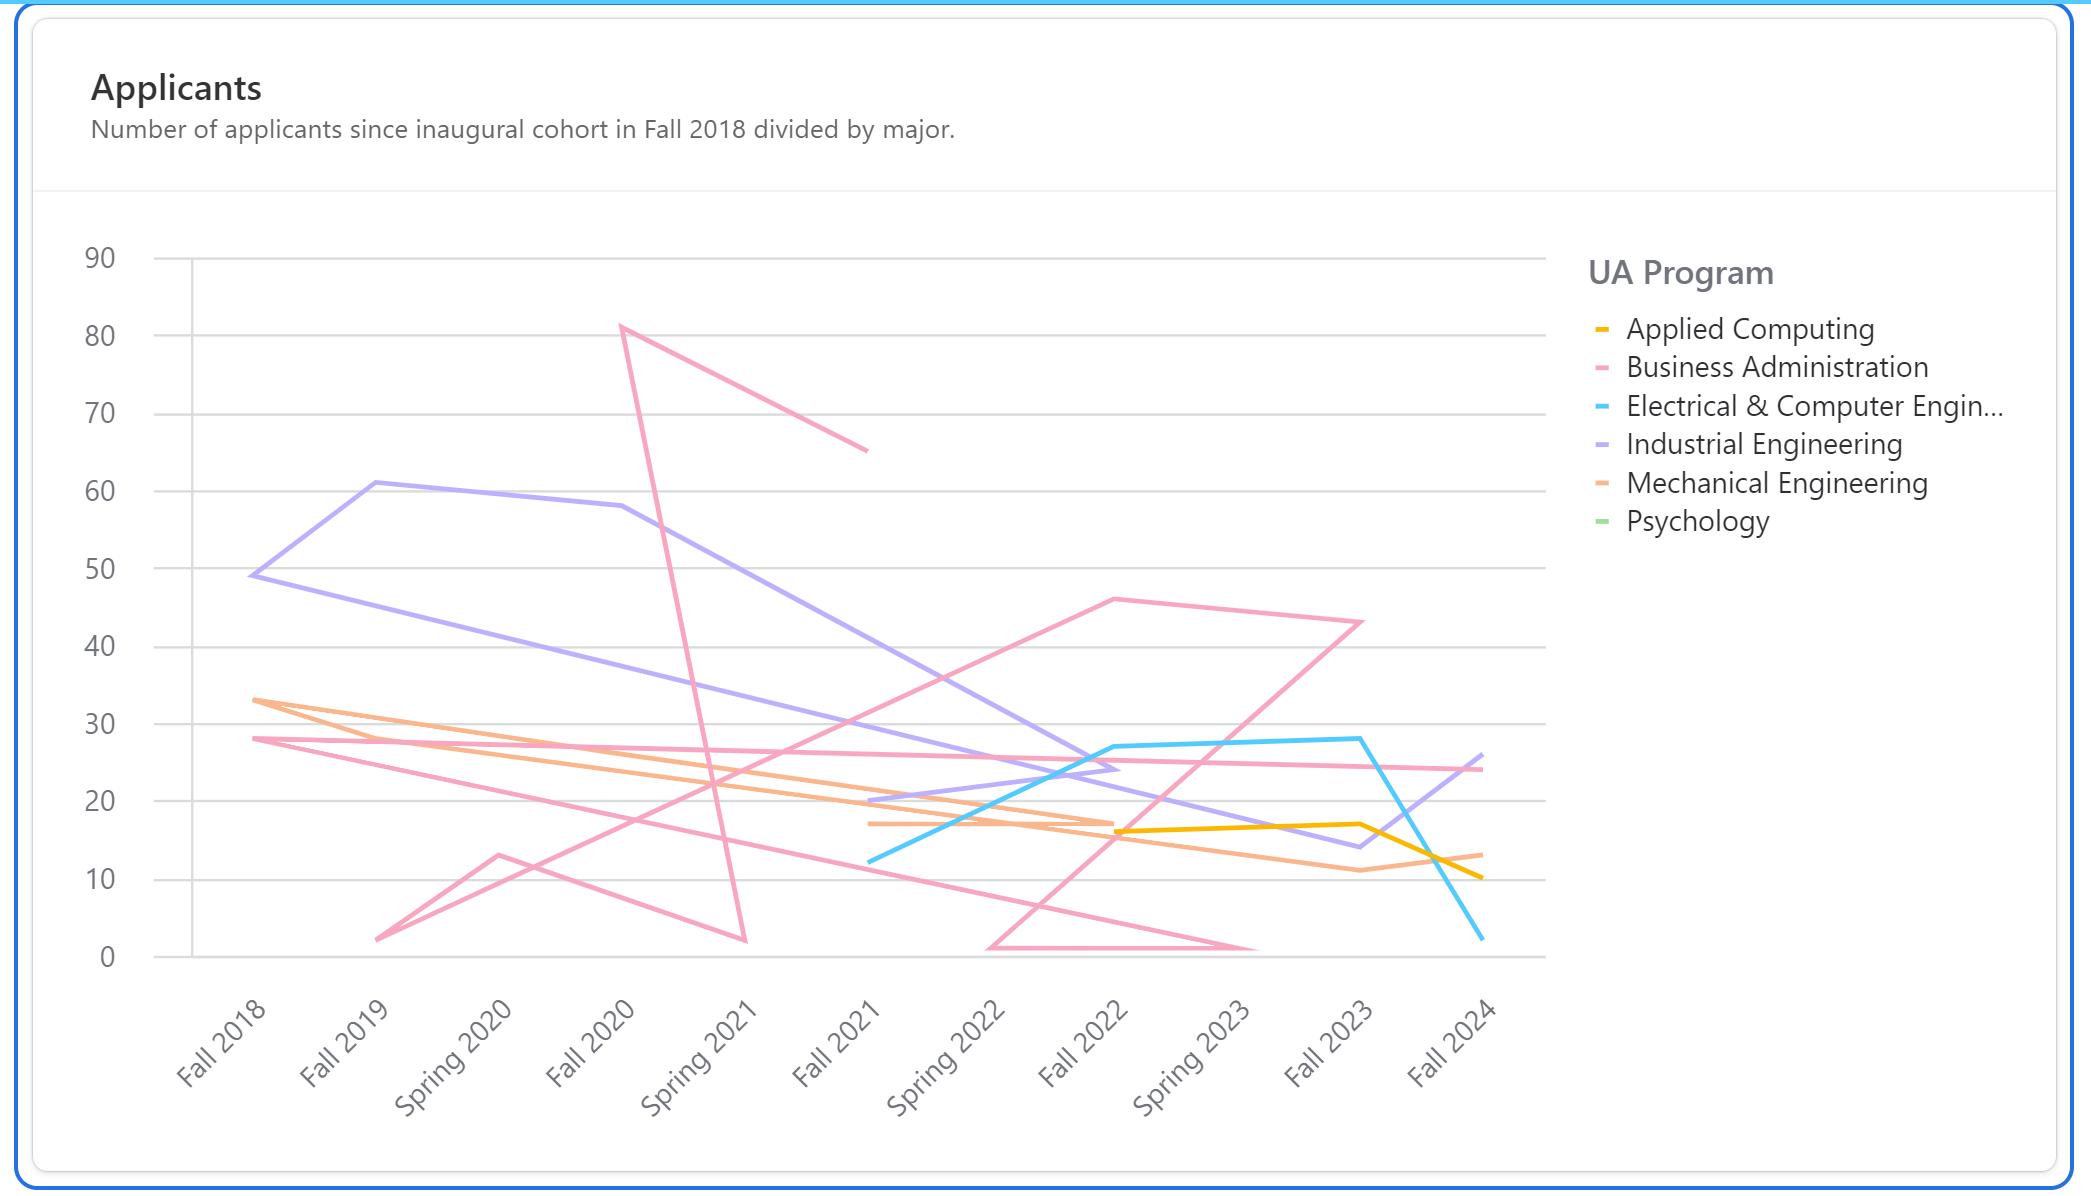
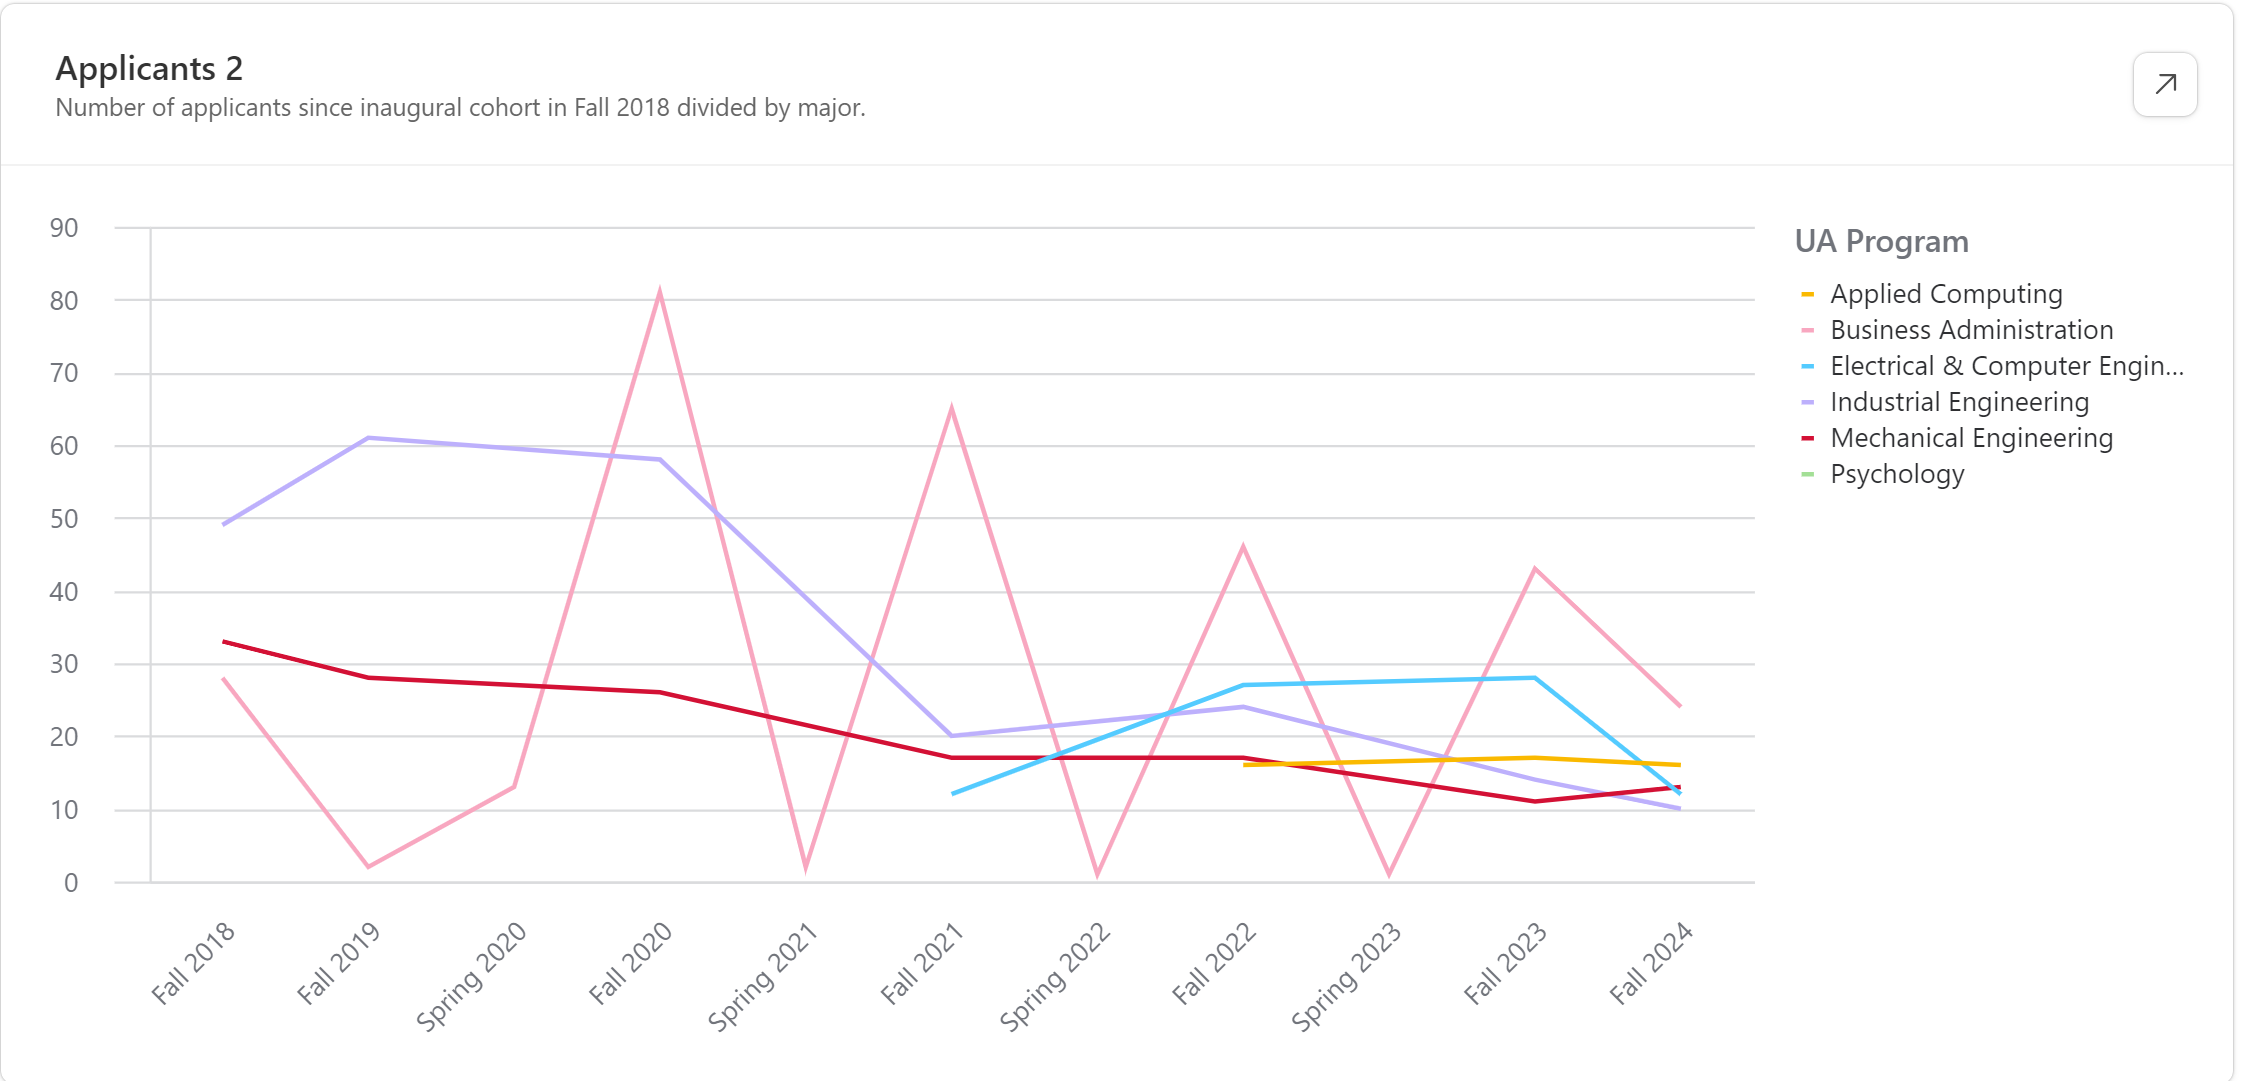
Anyone have an idea as to why my line graph is a bunch of scribbles? I want to chart number of applicants to specific majors overtime from term to term. The terms are in the correct chronological order on the x-axis, but for some reason the lines start in random terms and jump to other random terms.
Well I am not sure what happened, but my line graphs are working the way I want them to now! Maybe there was a glitch and the information from the "Data" tab was not properly syncing to the "Interface" tab? Note that I did not change any information in "Data" nor any of the configuration options in "Interface."
Could you provide a read-only invite link to a duplicate of your base with some example data? It's quite difficult to troubleshoot this without access to the base setup!
Well I am not sure what happened, but my line graphs are working the way I want them to now! Maybe there was a glitch and the information from the "Data" tab was not properly syncing to the "Interface" tab? Note that I did not change any information in "Data" nor any of the configuration options in "Interface."