Hello!
I am trying to create a graph to show how many records where submitted in each month of each year, and for some reason I just can't think of a way to accomplish this.
Example Jan 2020 =1, Feb 2020 = 3 .......... 12 2024 = 89, 1 2025 = 90 sorted in order
Anyone know how to do it?

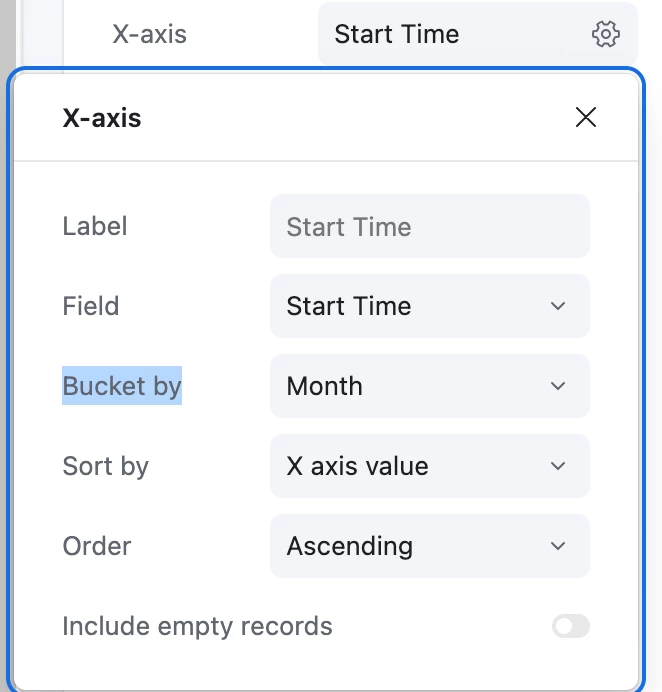
Month and year graph Interface
 +9
+9This topic has been closed for replies.

Enter your E-mail address. We'll send you an e-mail with instructions to reset your password.