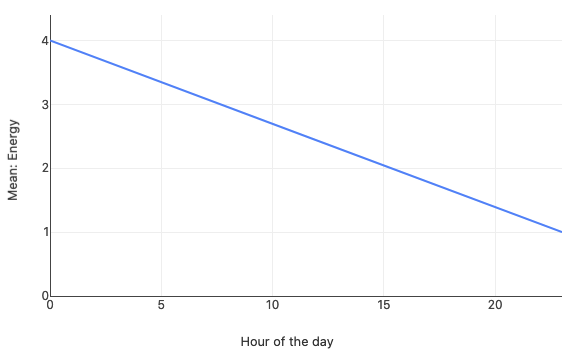
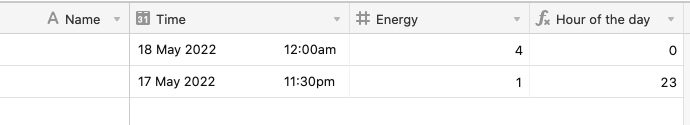
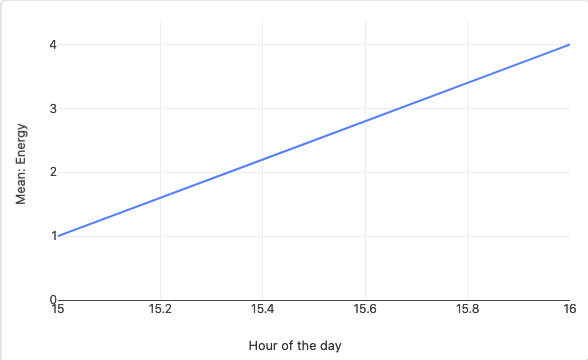
I have a table in my base that I use to track “energy level” which is rated 1-10. Each record also has a timestamp on it. I’d like to create a table that charts energy levels on an average day. I’m thinking I need an average energy level for each one-hour increment. Any suggestions?
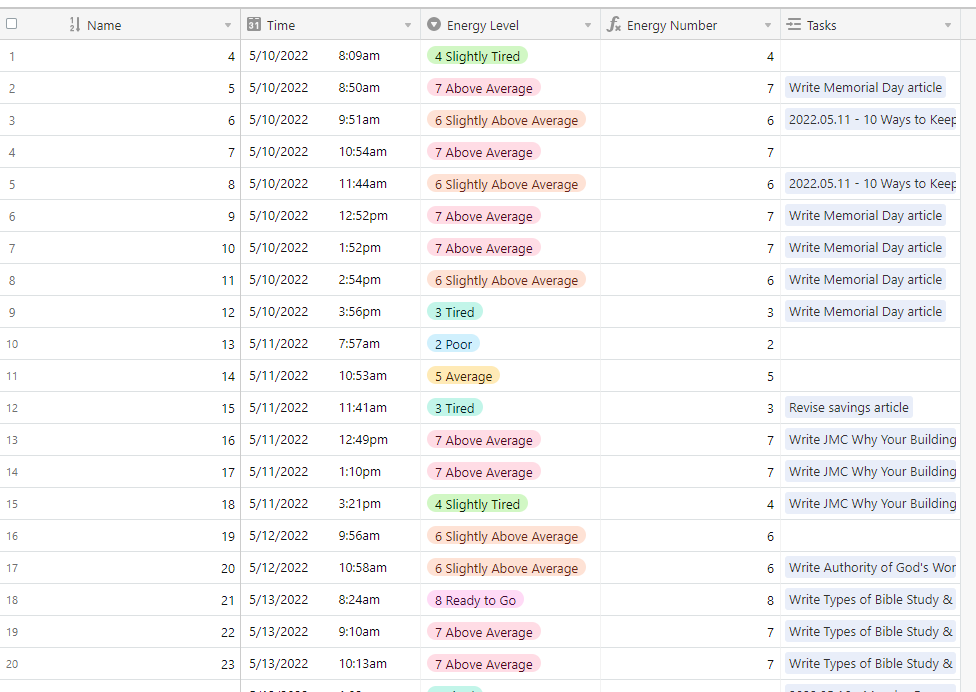

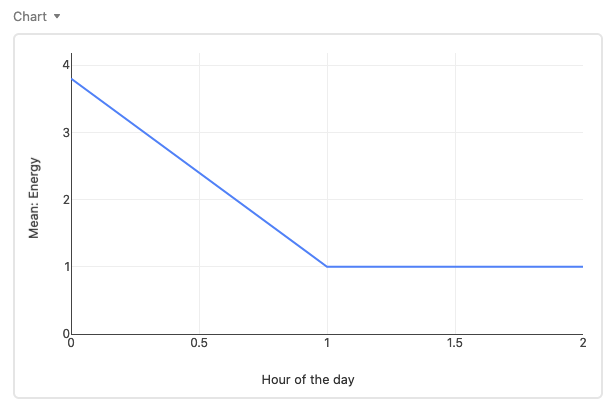
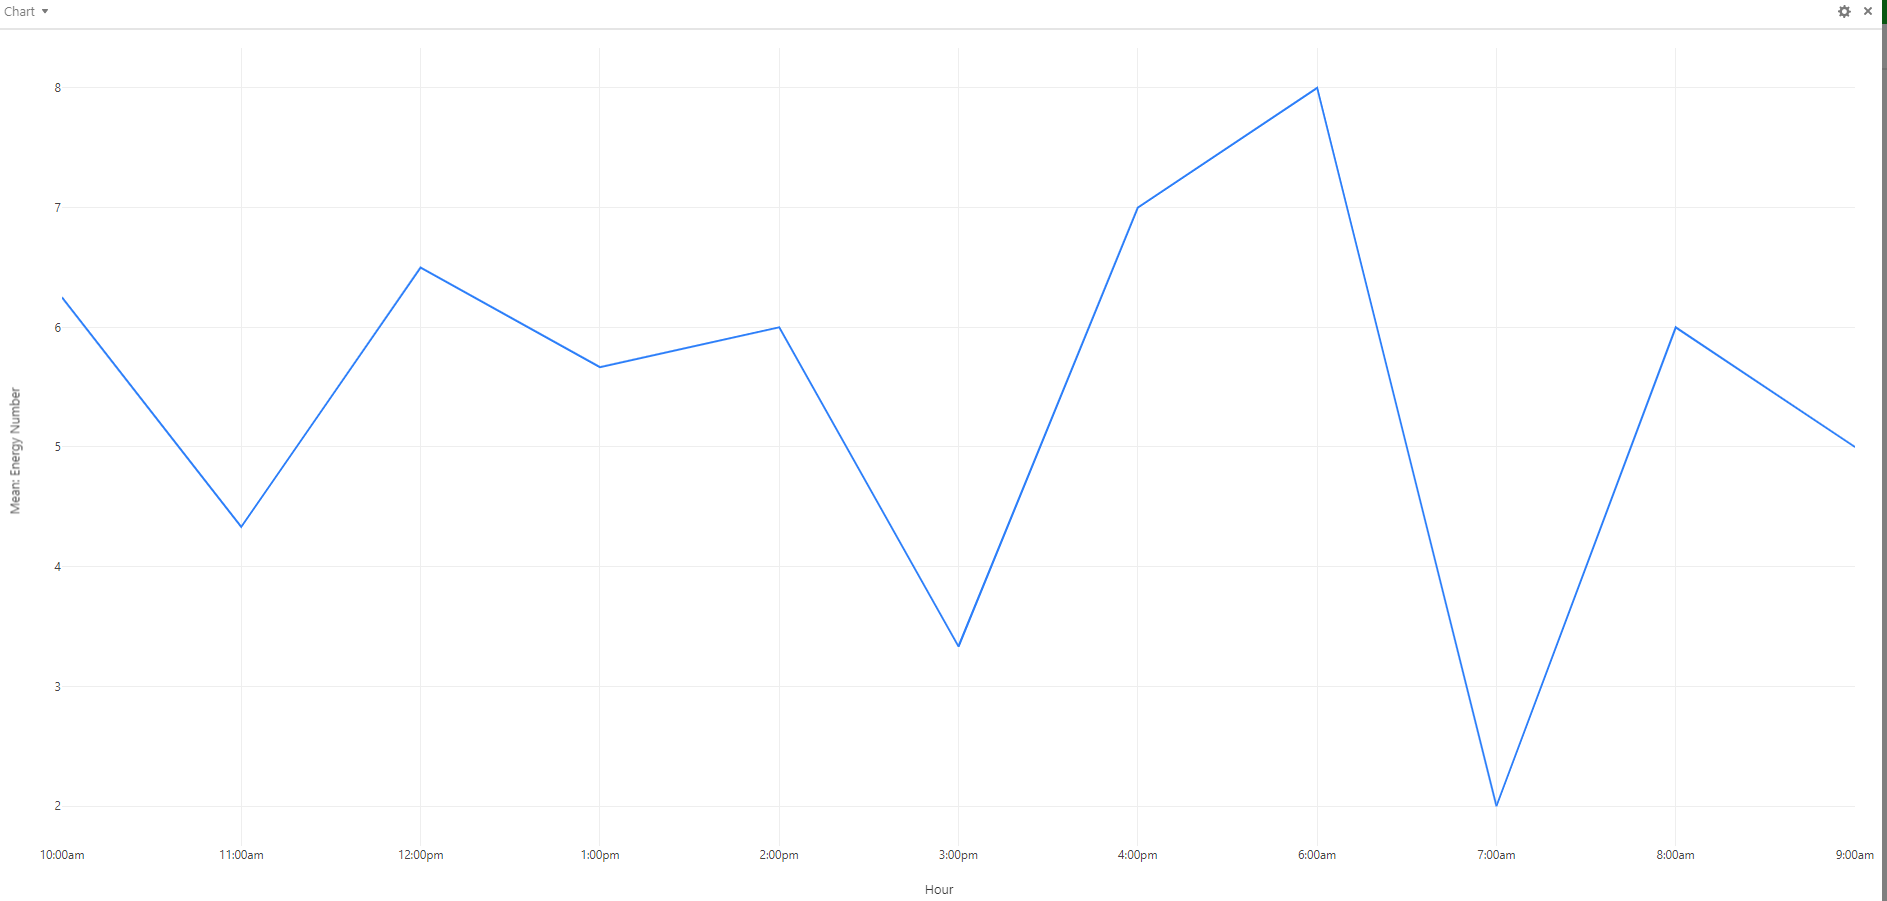
Chart visualization
 +7
+7This topic has been closed for replies.

Enter your E-mail address. We'll send you an e-mail with instructions to reset your password.