Hi All,
I’ve got a client that wants to be able to view airtable data in wix.
This has been easy enough when using a grid - eg customer comments for the last month.
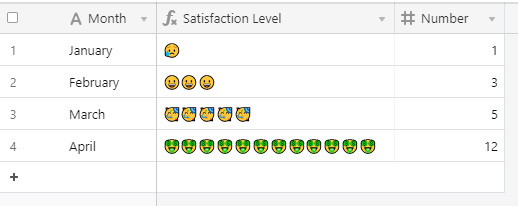
But,… what I’d like to do is have a chart eg “customer satisfaction by month” grid data is “date” and “rating” (values of 1, 2 or 3).
The awful solution i can think of is manually export to csv, generate the chart, save as image, the save to webpage - but that is awful. Is there something I could do with API? That is way beyond my capabilities though (but I’d happily accept help or pay someone via a freelancer app)
I’m not committed to wix so if there is another way I’m open to that.
Thanks heaps in Advance :slightly_smiling_face: