Hi, I’d like to create a line chart that tracks my progress in writing a book. My goal is to write 90000 words in 180 days, which is 500 words a day.
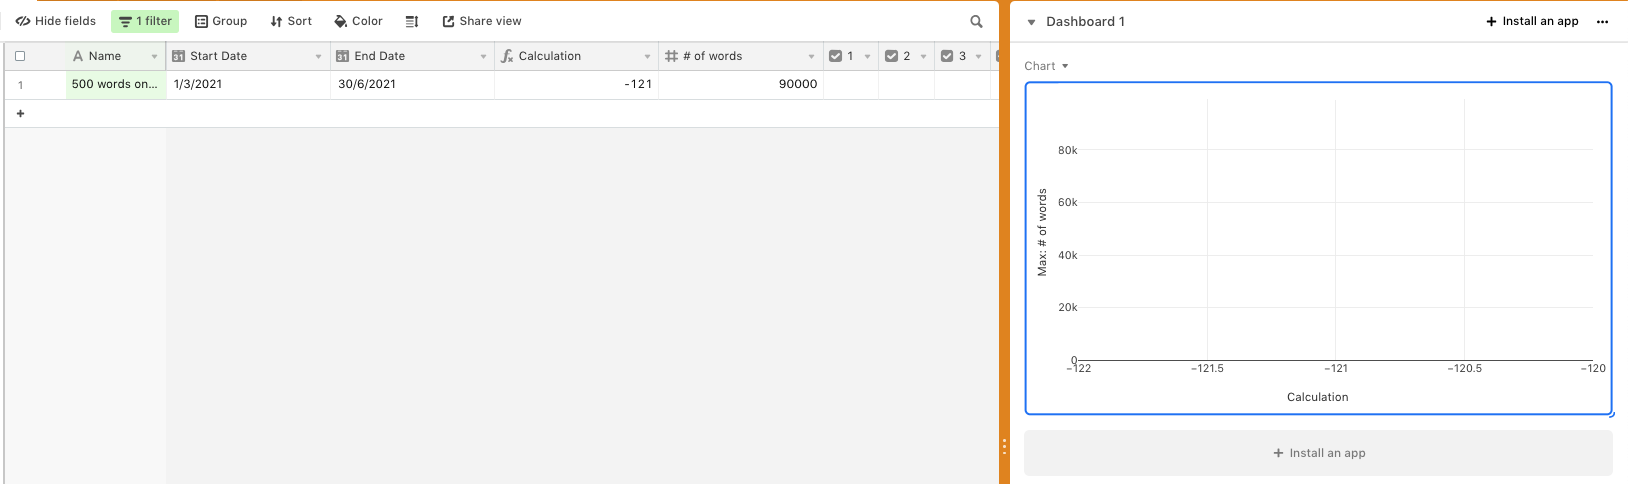
I have the Y axis (# of words) already set, but I can’t seem to figure out the X axis (see image below)…
How can I complete this so that when I write my 500 words in a day, I add it into Airtable and it shows me progress towards that 90K word target?
Any help is greatly appreciated. Thanks!