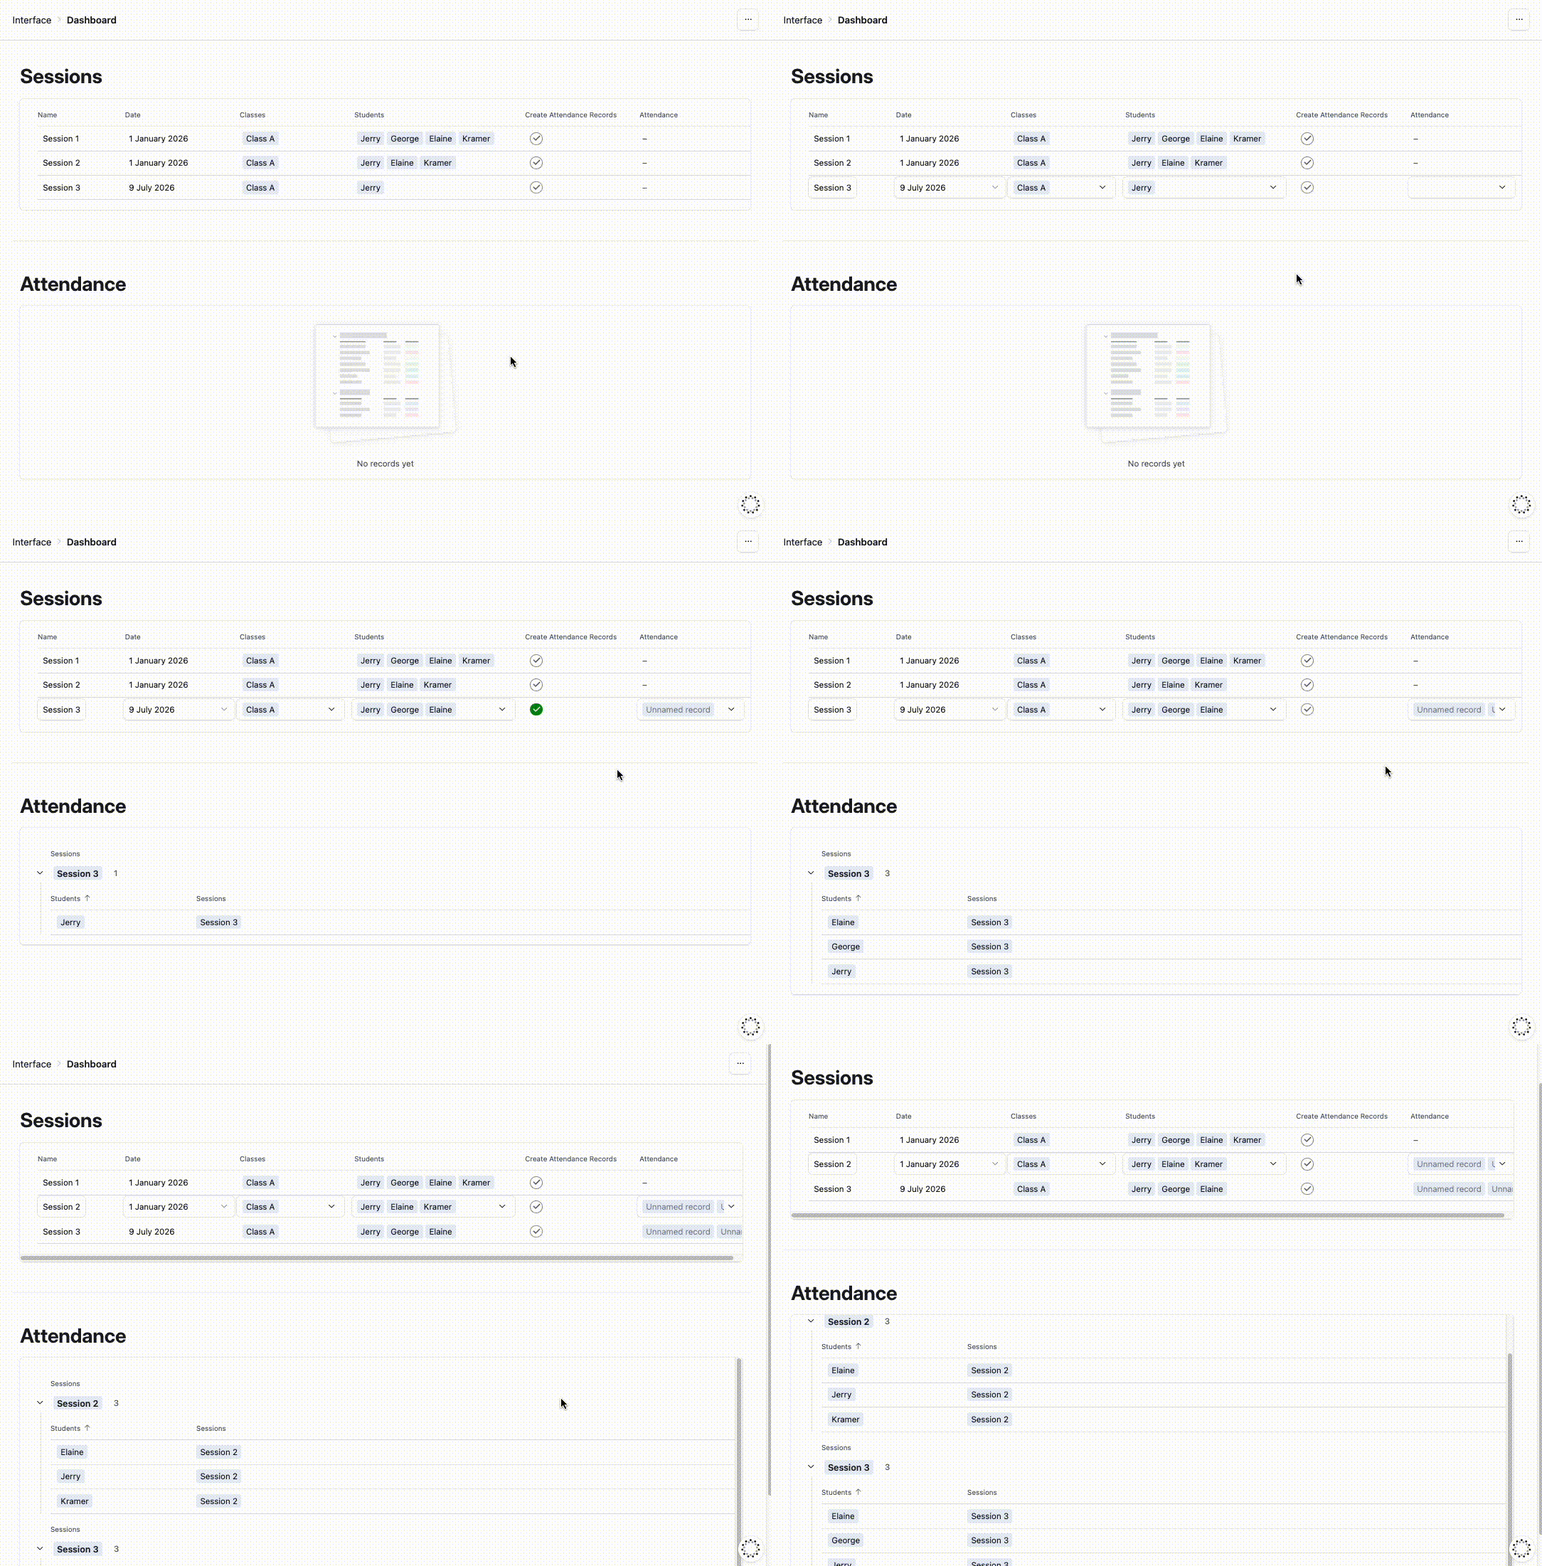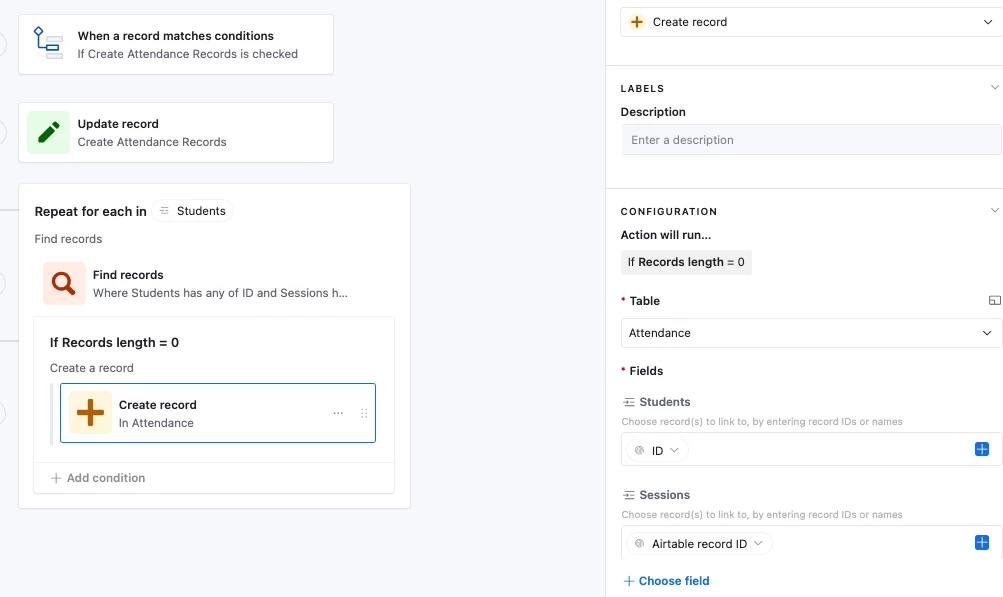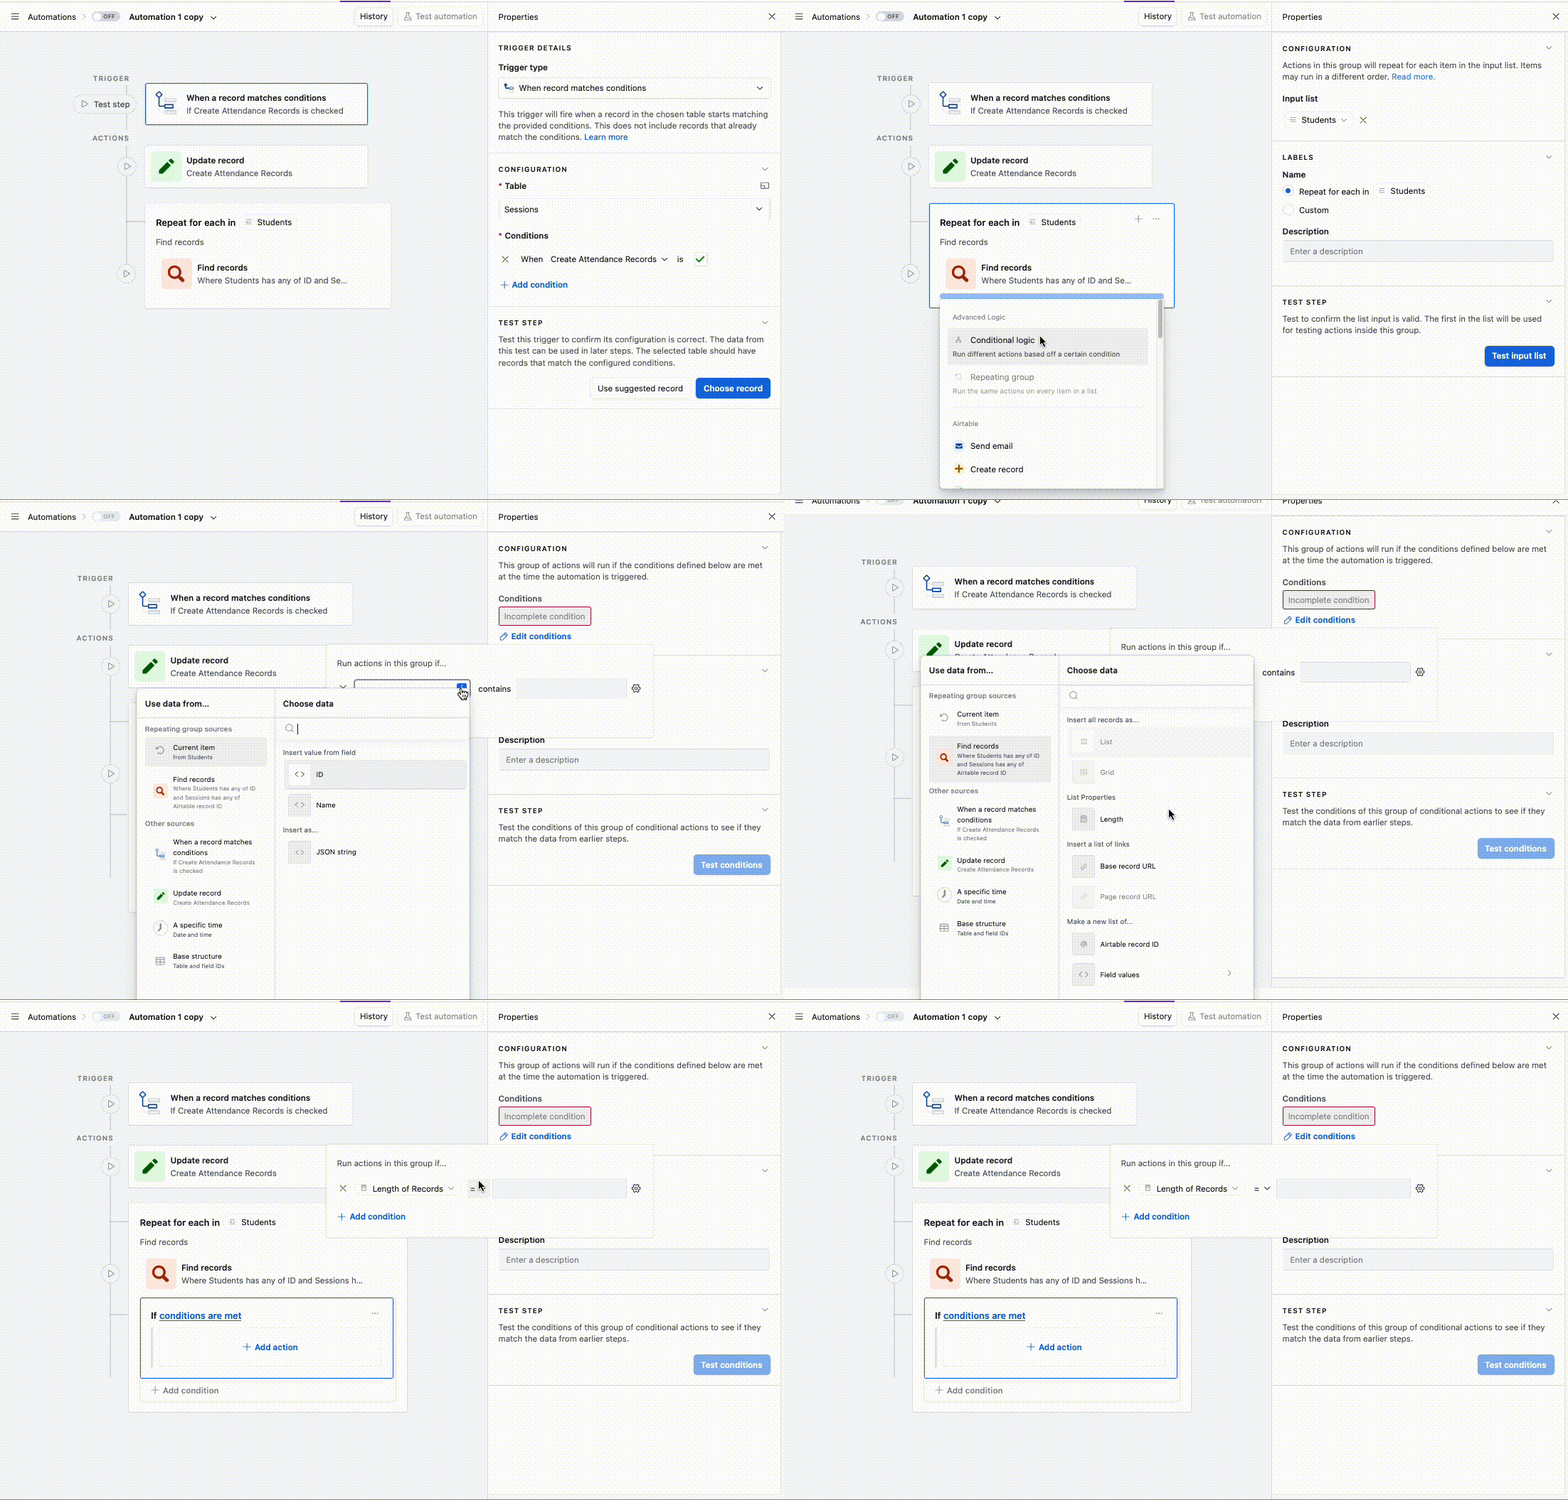

I am working with a small nonprofit foreign language school. I need to create a report that shows the # students in attendance each quarter. I have the following tables:
- Students
- Classes
- Attendance
Each Attendance record has the following fields:
- Class session ID
- Date of session
- Class (each class is specific to a year, so FY26 Eng100)
- Class Hours (# hours per session)
- Year-Quarter (a formula field that calculates year & quarter based on date of session. ie 2026 Q2)
- Students present
- # Students present
Each Student record has the following fields:
- Student name
- current classes (each class is specific to a year, so FY26 Eng100)
- previous classes
- attendance (which links to Attendance, and lists all the class sessions that student has attended)
- quarters in attendance (rollup field: source is Attendance, rolls up ArrayUnique of Year-Quarter)
- Rollup fields of # hours attended each quarter: “2025 Q4 Attendance hours”, “2026 Q1 Attendance Hours” Etc
- Demographic data about student (region, age, gender, etc)
How can I pull reports that show # students in attendance each quarter? And demographic reports like # students from a region in each quarter? I thought I could use Pivot Tables to do so but