Showing ideas with label Interface Designer.
Show all ideas
Status:
New Ideas
Submitted on
Oct 01, 2024
03:02 AM
Submitted by
SamGluck
 on
Oct 01, 2024
03:02 AM
on
Oct 01, 2024
03:02 AM
What is the proposed idea/solution? Currently we've got the option of formatting a formula field as a single select, I'd like to format it as a muliple choice How does is solve the user problems? I'd use this feature for labeling records with what fields still need to be filled. Lets say the Name and Email fields are empty, it would show at the top of the record red labels of what information still needs to be filled in the record, and as you enter the info, the labels disappear. Yes you can use automations with a script for this, but it doesn't work instant. it takes 10-15 seconds per run. using a formula would be instant.
... View more
Status:
New Ideas
Submitted on
Jan 02, 2024
08:14 AM
Submitted by
Tim_Berezny
 on
Jan 02, 2024
08:14 AM
on
Jan 02, 2024
08:14 AM
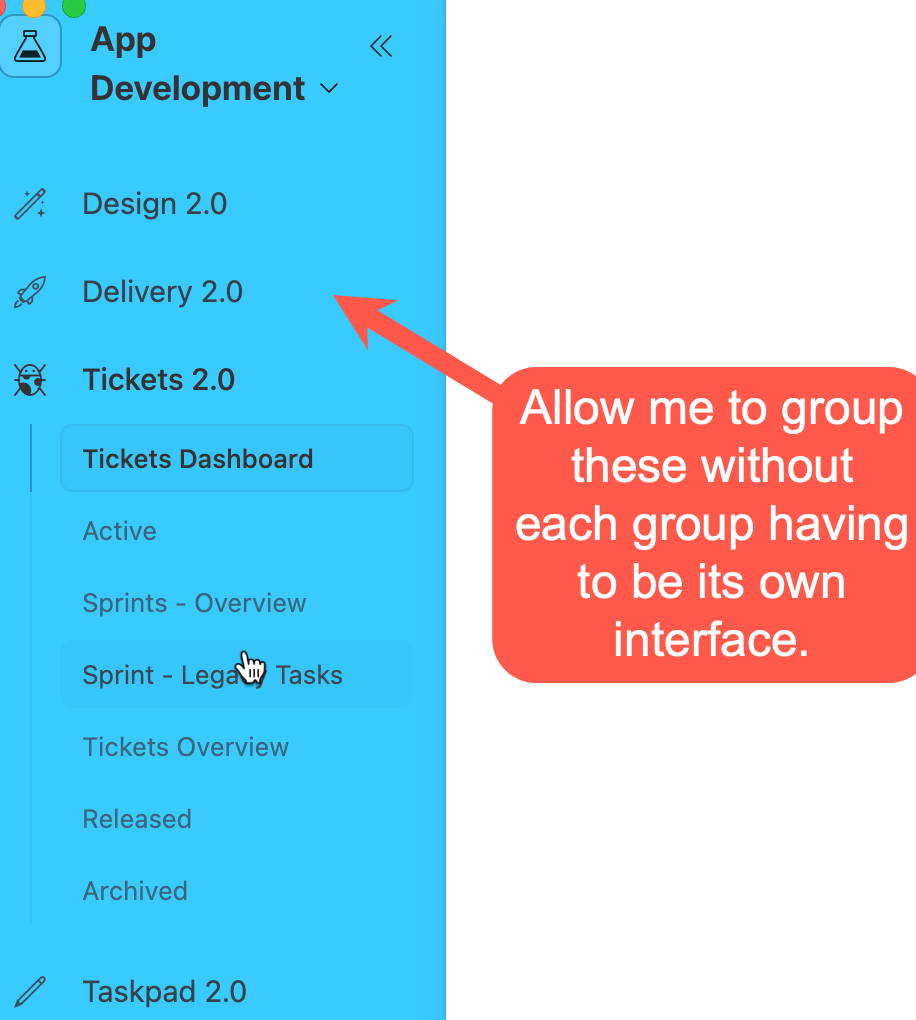
What is the proposed idea/solution? Allow the same "record detail page" to be used across multiple interfaces How does is solve the user problems? Currently a designed "record detail page" is restricted to ONE interface. However, since we can incorporate multiple interfaces across one app (via the left nav bar navigation in interfaces), it is common to need to access the same record from a different interface. Currently you have to rebuild the the record detail page for every interface that it's data is used in. (We currently have 4 interfaces, so we have to duplicate 4 times). Not only that, every time we make a change we have to change it in 4 places. ALTERNATE SOLUTION The add the ability to group pages on the left nav panel without needing to stick them into different interfaces. How was this validated? At my company we've probably wasted 200 hours trying to keep our record details pages in sync, Who is the target audience? Interface app builders
... View more
Submitted on
Sep 28, 2022
09:09 AM
Submitted by
Joel_Lee
on
Sep 28, 2022
09:09 AM
First, let me start off by saying how incredibly important this feature is. The data so many organizations could have by being able to create custom calculated metrics in Interfaces is untellable. When creating big numbers (like the Numbers widget in an Interface), you are tired to a specific field, then you must select an operator. For example, you tie that Number widget to a field in one of your tables, for example, “Revenue,” then select “Sum” and it gives you the total. Let’s say you did that same thing for “Profit.” Then, with those two metrics, there is no way to create a third one based off those that calculates, for example, something like: Profit / Revenue (displayed as a percentage (Margin)). The problem is that the only workaround to achieve the above (something that is a basic feature in, for example, Google Data Studio), is to build in the Profit, Revenue, and Margin fields at the table level which can fail to work if you are dealing with a metric for which there is no workable operator. For example, you cannot use “Sum” in the settings of a Number widget in an Interface in order to sum up all the “Margin” values in your table. That doesn’t make sense. Long story short, I would love if, in Interfaces, you could calculate your own metrics. The flexibility this would provide would help people who are using Interfaces for basic financial or other number-based widgets, and could give them the insights they need (like the organization I work for!).
... View more
Status:
New Ideas
Submitted on
Jan 09, 2023
08:42 AM
Submitted by
raechyl
on
Jan 09, 2023
08:42 AM
I'd like to request that Interfaces get the same sharing options the rest of the base gets - specifically the ability to share publicly without someone having to have an account/base access to see it. If you can do this in a base, you should be able to do it in the Interface, which is theoretically designed for sharing. This is a feature I've seen numerous people request - just adding my voice to it. It would transform our workflow, and currently, this is the only thing Smartsheet has on Airtable in my mind. I can't convince the rest of our team to transition to Airtable if we don't have this feature.
... View more
Status:
New Ideas
Submitted on
Aug 24, 2024
09:44 AM
Submitted by
Pascal_Gallais-
 on
Aug 24, 2024
09:44 AM
on
Aug 24, 2024
09:44 AM
Hello, I would like to have the abilty to add some computations in interfaces' pivot tables. Let us consider the following pivot table: User can filter the table with field "Group" and hence get different "vertical totals": I would like the ability to define % of each value against the vertical total in each column, hence to compute the share of value between each car maker. Thank you Pascal
... View more
Status:
New Ideas
Submitted on
Feb 23, 2023
12:04 PM
Submitted by
Shannon_Ball
on
Feb 23, 2023
12:04 PM
I'd like to suggest that you add the ability to wrap text in the Interface List element, the same way it gets wrapped in the Grid element. I want to use the List element because it's more visually appealing than the Grid, but it's more challenging to see all the information at once, especially for fields where I'm listing multiple linked records.
... View more
Status:
New Ideas
Submitted on
Feb 10, 2023
10:53 AM
Submitted by
Perrin_Romney
on
Feb 10, 2023
10:53 AM
What is the proposed idea/solution? Make Interfaces available on the iPad How does is solve the user problems? In construction, we use iPads for most of our inspection and statusing. To not have an interface useable on the iPad app is a major barrier to being able to use this in the field. How was this validated? ... Who is the target audience? Anyone who uses Airtable not sitting down
... View more
Status:
New Ideas
Submitted on
Feb 16, 2024
10:48 AM
Submitted by
Danarone
on
Feb 16, 2024
10:48 AM
What is the proposed idea/solution? This idea proposes more dynamic options for scaling, rotating or providing 'hovering information' for text in Field Headings so they are readable when columns are narrow in Grid View and List Views. Currently text very easily becomes truncated and unreadable. Row height helps with field contents but not Field Headings. Hovering only works if there is a Description in the Field. Note: this idea is essentially requesting behavior that you see in most spreadsheet programs. Here is a typical Grid view... When you shrink the columns it looks like this which is too easily truncated and unreadable... Proposed Idea A: Enable hovering context information for all text whether there is a Description in the Field or not. If there is a Field Description it would be displayed underneath the Field Name in the floating context window. Proposed Idea B: Field Names can be rotated (similar to spreadsheets). Maybe 45 and 90 (as shown below) Field Names and all other text scales down to ~6 point before it begins truncating. Like the 'In Progress' text below Overall make the margins in all fields super tight. Field Row Height can be changed so the text wraps and stacks. (Not shown below but you get the idea) ... How does is solve the user problems? Keeps information readable when trying to conserve screen real-estate. ... How was this validated? Not validated yet. ... Who is the target audience? Creators who are trying to show as much information as possible on the screen while keeping information readable. ...
... View more
Status:
New Ideas
Submitted on
Jun 14, 2024
12:13 PM
Submitted by
Joseph_Roza
 on
Jun 14, 2024
12:13 PM
on
Jun 14, 2024
12:13 PM
What is the proposed idea/solution? This is a crosspost in the actual 'ideas' forum. I originally proposed this here When opening a record details page (sidesheet/full page), I'd like to be able to press a button to open the same record details but in a different, customized record detail page. I have so many customized record detail pages that I would love to make use of, but the only way to currently do that is in a different interface page, or use the 'open url in record' hack that has to reload the entire page to work, which is a bit clunky. How does is solve the user problems? Simple use case: open record details to view information that is not edit'able, click button to open the edit'able version of the record. How was this validated? I use hacks on every single one of my airtable apps to do this already. Who is the target audience? Honestly, I can imagine just about every interface-builder would use this. It would open so many options.
... View more
Status:
New Ideas
Submitted on
Jul 06, 2023
03:08 AM
Submitted by
Alex_Godfrey
on
Jul 06, 2023
03:08 AM
What is the proposed idea/solution? Allow visual representations for extensions such as Base Schéma, Org Charts or Maps to be included in the Interface pages. How does is solve the user problems? ... How was this validated? ... Who is the target audience? ...
... View more
